ZONE DIGGA
The levels everyone agrees on before price arrives — and the ones the chart built for itself.
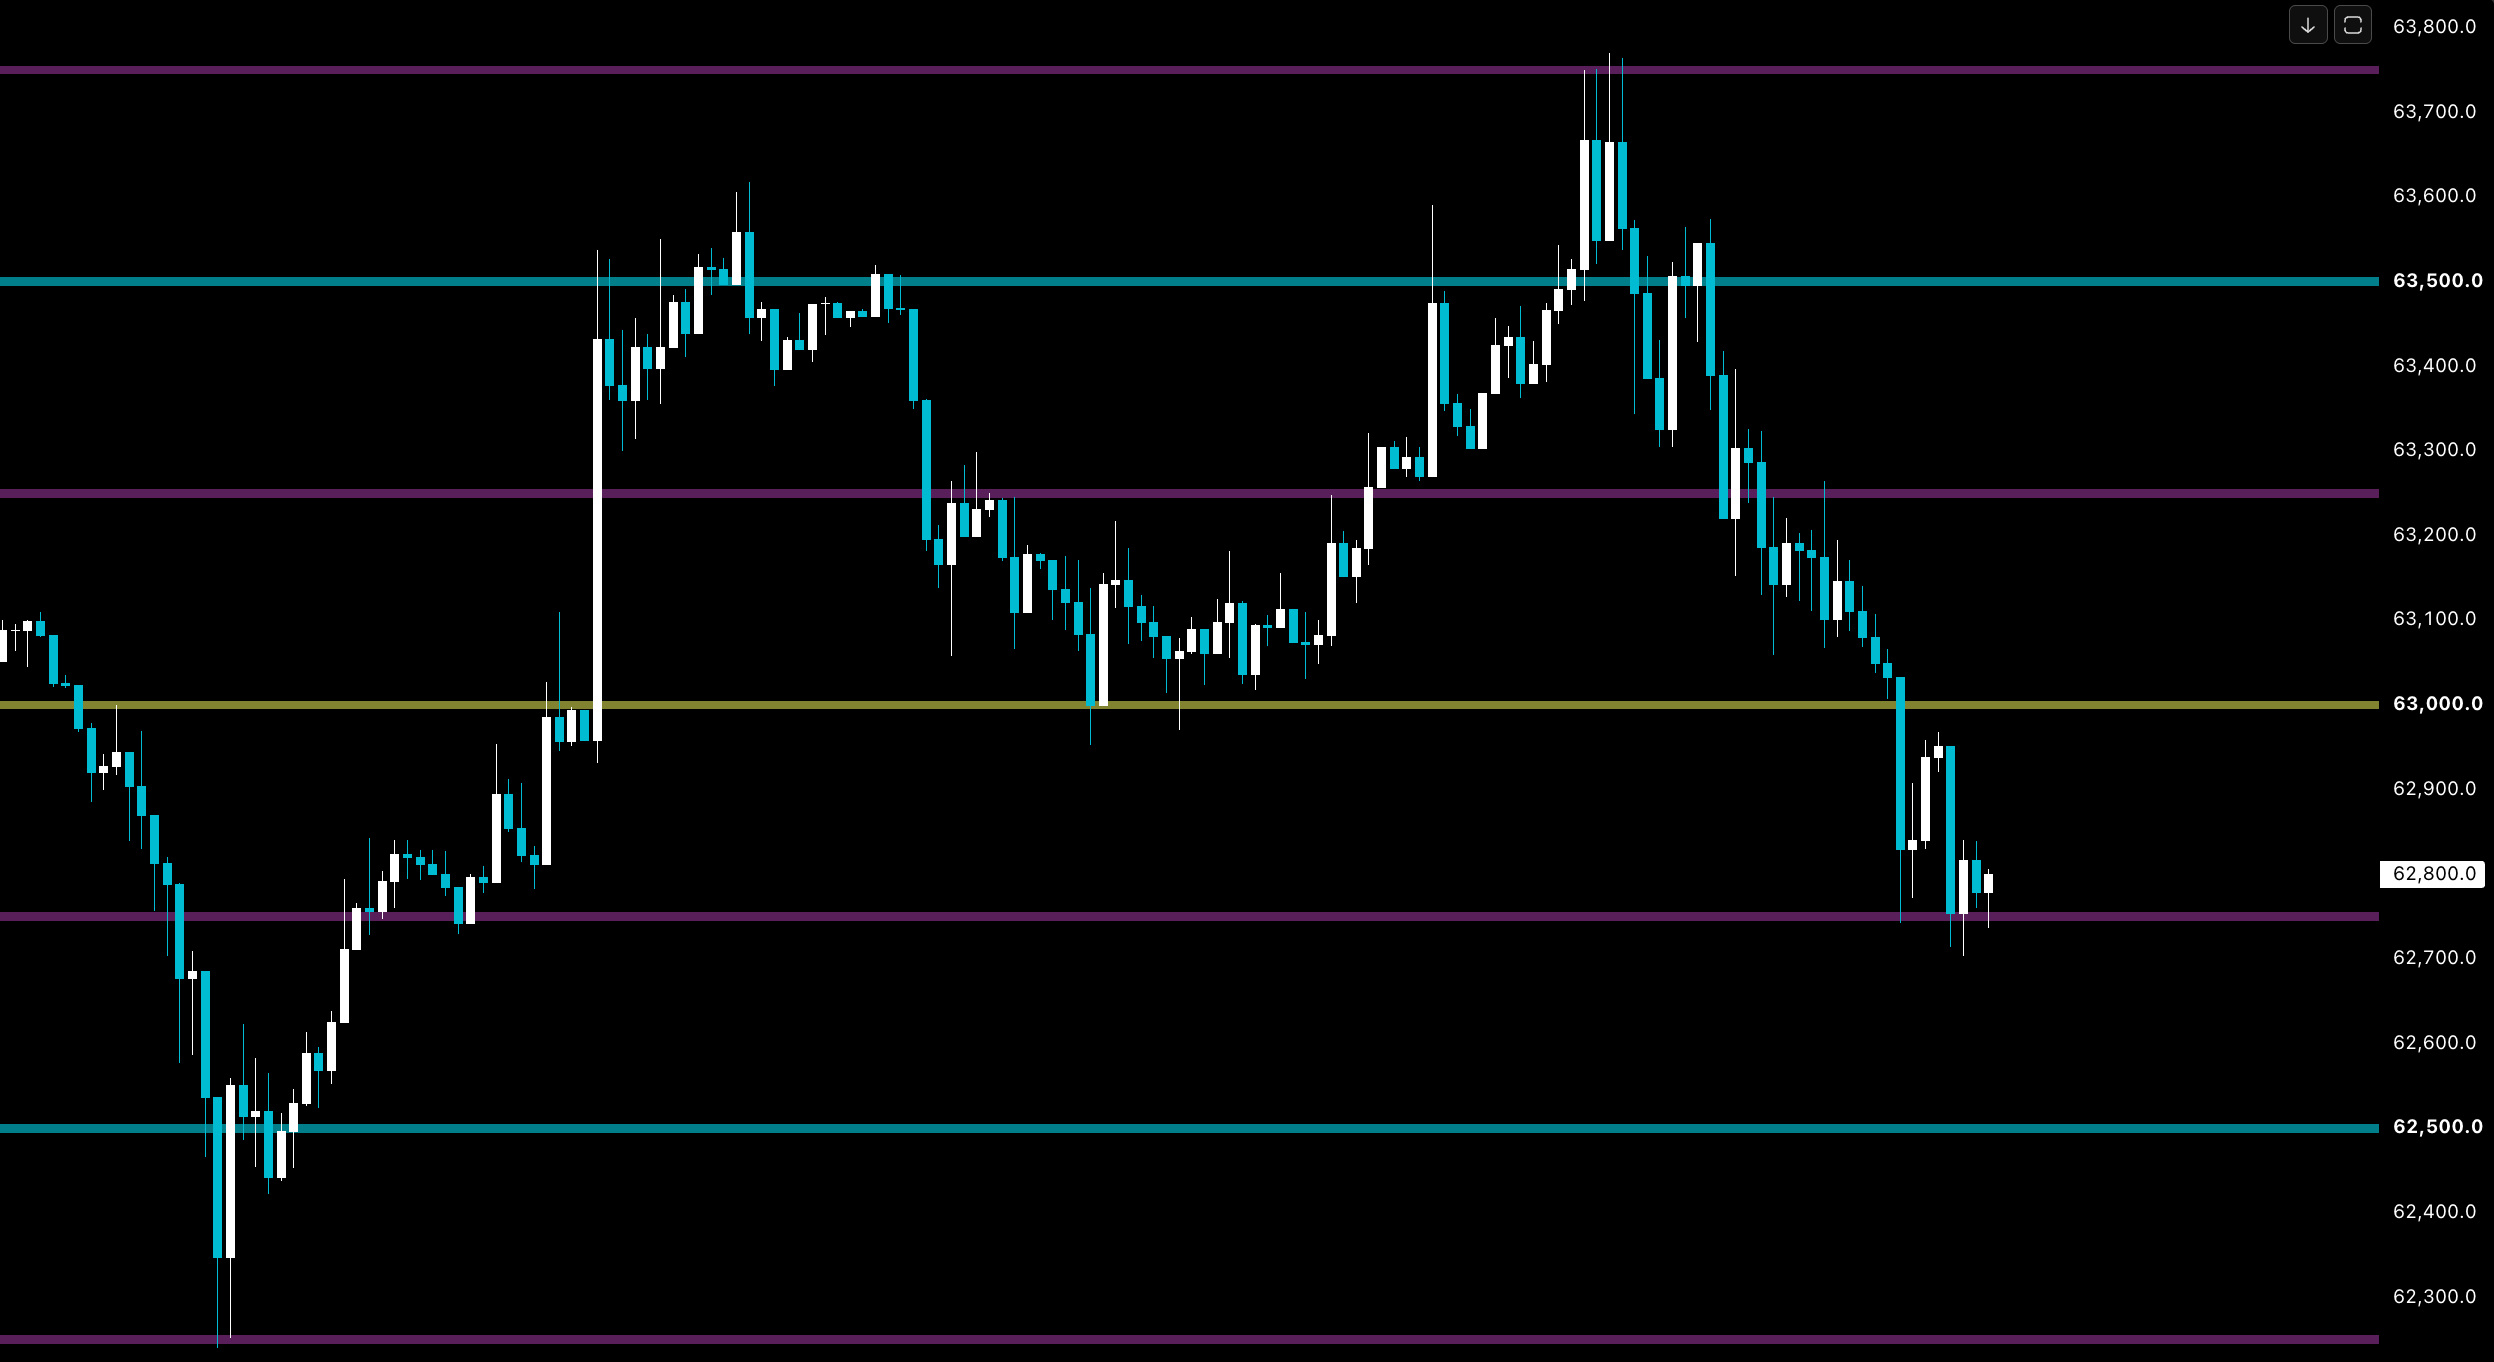
Markets remember round numbers. Price stalls at them, bounces off them and accelerates through them — on gold, on Bitcoin, on the Nasdaq, on EUR/USD. ZONE DIGGA draws those zones on any chart without a single setting to configure.
The paid indicators already use these levels internally and keep them hidden, so the chart stays clean. Add ZONE DIGGA on top when you want to see what a setup is reacting to, and switch it off with one click when you want the quiet chart back.
ver2.0 — the other kind of level
Round numbers are agreed on before price ever gets there. The second kind is built by the chart itself: the shelves where price turned again and again and left a cluster of swing highs and lows behind. ver2.0 finds those too, and a pivot level landing on a round number is the strongest thing this script can show you.
One dropdown at the top picks Psych grid — everything ver1.0 did, untouched — or Pivot S/R, or both together.
Highs and lows are one population. A ceiling that held three times keeps its history when price later leans on it as a floor; it is the same shelf. How close two swings must sit to count as one level is measured in ATR, so the rule fits a quiet forex pair and a violent coin without being retuned.
Levels weaken, then go. A level is drawn thicker the more swings stand behind it. A close that runs clean through takes a mark; a poke that comes straight back costs it nothing. Enough marks and it turns dashed, then it is dropped. A price that no longer stops anything stops being drawn.
Several timeframes at once — your chart alone, or 15m · 1H · 4H, or 1H · 4H · 1D, or all of them. Each runs a completely independent engine with its own ATR, because a 4H shelf and a 5m shelf are not the same size of thing. A timeframe below your chart’s is skipped rather than invented from bars that cannot show it.
Readable by other scripts. The nearest level above and below price, the swings and breaks behind each, and the distance to the closer one in ATR are published as plots any indicator can read through its source input.
Both engines draw points of interest, not signals.
What you get
- Round-number zones drawn on any symbol, any timeframe, with nothing to configure
- A second engine — the shelves price turned at again and again, found from its own swings
- Highs and lows counted as one population, because a ceiling that breaks becomes a floor
- Levels thicken with the swings behind them, weaken on a clean break, then are dropped
- Your chart alone, or three timeframes at once, each with its own independent engine
- Asset class detected automatically — metals, crypto, indices, forex, the dollar index
- Published as plots, so your own scripts can read the nearest level above and below
- Alerts on major zones, minor zones, or any zone at all
What changed, version by version.
The one note so far for ZONE DIGGA, as posted to subscribers. Open it to read it in full.
ZONE DIGGA ver2.0 — the levels the chart drew itself
ZONE DIGGA ver2.0 — the levels the chart drew itself
ZONE DIGGA has always drawn the levels the market agrees on before price ever gets there: round numbers. ver2.0 adds the other kind — the shelves a chart builds for itself, where price turned again and again and left a cluster of swing highs and lows behind.
A second engine. One dropdown at the top picks Psych grid (everything ver1.0 did, untouched), Pivot S/R, or Both. A pivot level landing on a round number is the strongest thing this script can show you.
Highs and lows count as one population. A ceiling that held three times keeps its history when price later leans on it as a floor — it is the same shelf. How close two swings must sit to count as one level is measured in ATR, so the rule fits a quiet forex pair and a violent coin without being retuned.
Levels weaken, then go. A level is drawn thicker the more swings stand behind it. A close that runs clean through takes a mark; a poke that comes straight back costs it nothing. Enough marks and it turns dashed, then it is dropped. A price that no longer stops anything stops being drawn.
Several timeframes at once. Your chart alone, or 15m · 1H · 4H, or 1H · 4H · 1D, or all of them — each in its own colour, each running a completely independent engine with its own ATR, because a 4H shelf and a 5m shelf are not the same size of thing. A timeframe below your chart’s is skipped rather than invented from bars that cannot show it.
Readable by other scripts. The nearest level above and below price, the swings and breaks behind each, and the distance to the closer one in ATR are published as plots any indicator can read through its source input. Nothing in the family consumes them yet — they are there for your own tools.
Both engines draw points of interest, not signals. Included with PRO and PRO ULTRA as before, and everything in the psychological grid behaves exactly as in ver1.0.