Measured means something specific.
Every configuration shipped here came off a bench, under a protocol. Here is the protocol, what would sink a result, and what a finished measurement turns into.
A lane is measured on its own, and the account holds one position at a time. Run five lanes together and you cannot tell which one earned the result — or which one paid for it.
A full year rather than a stretch that flatters, deep backtesting so intrabar fills are real rather than assumed, and commission charged. A result quoted without its costs is a result quoted without its losses.
The year is split and the configuration has to work in each half. A setting that earns everything in one half and gives it back in the other was fitted to the past, and it is the single most common way a backtest lies.
Plenty of ideas have failed that protocol here, and the ones that failed were dropped rather than shipped with a switch. A bench that keeps a knob its own measurements refuted would be selling noise.
A worked example, on an instrument nobody shipped.
ULTRA is the same engine as a TradingView strategy, so a configuration can be measured rather than believed. This is one, on Ethereum, over a year.
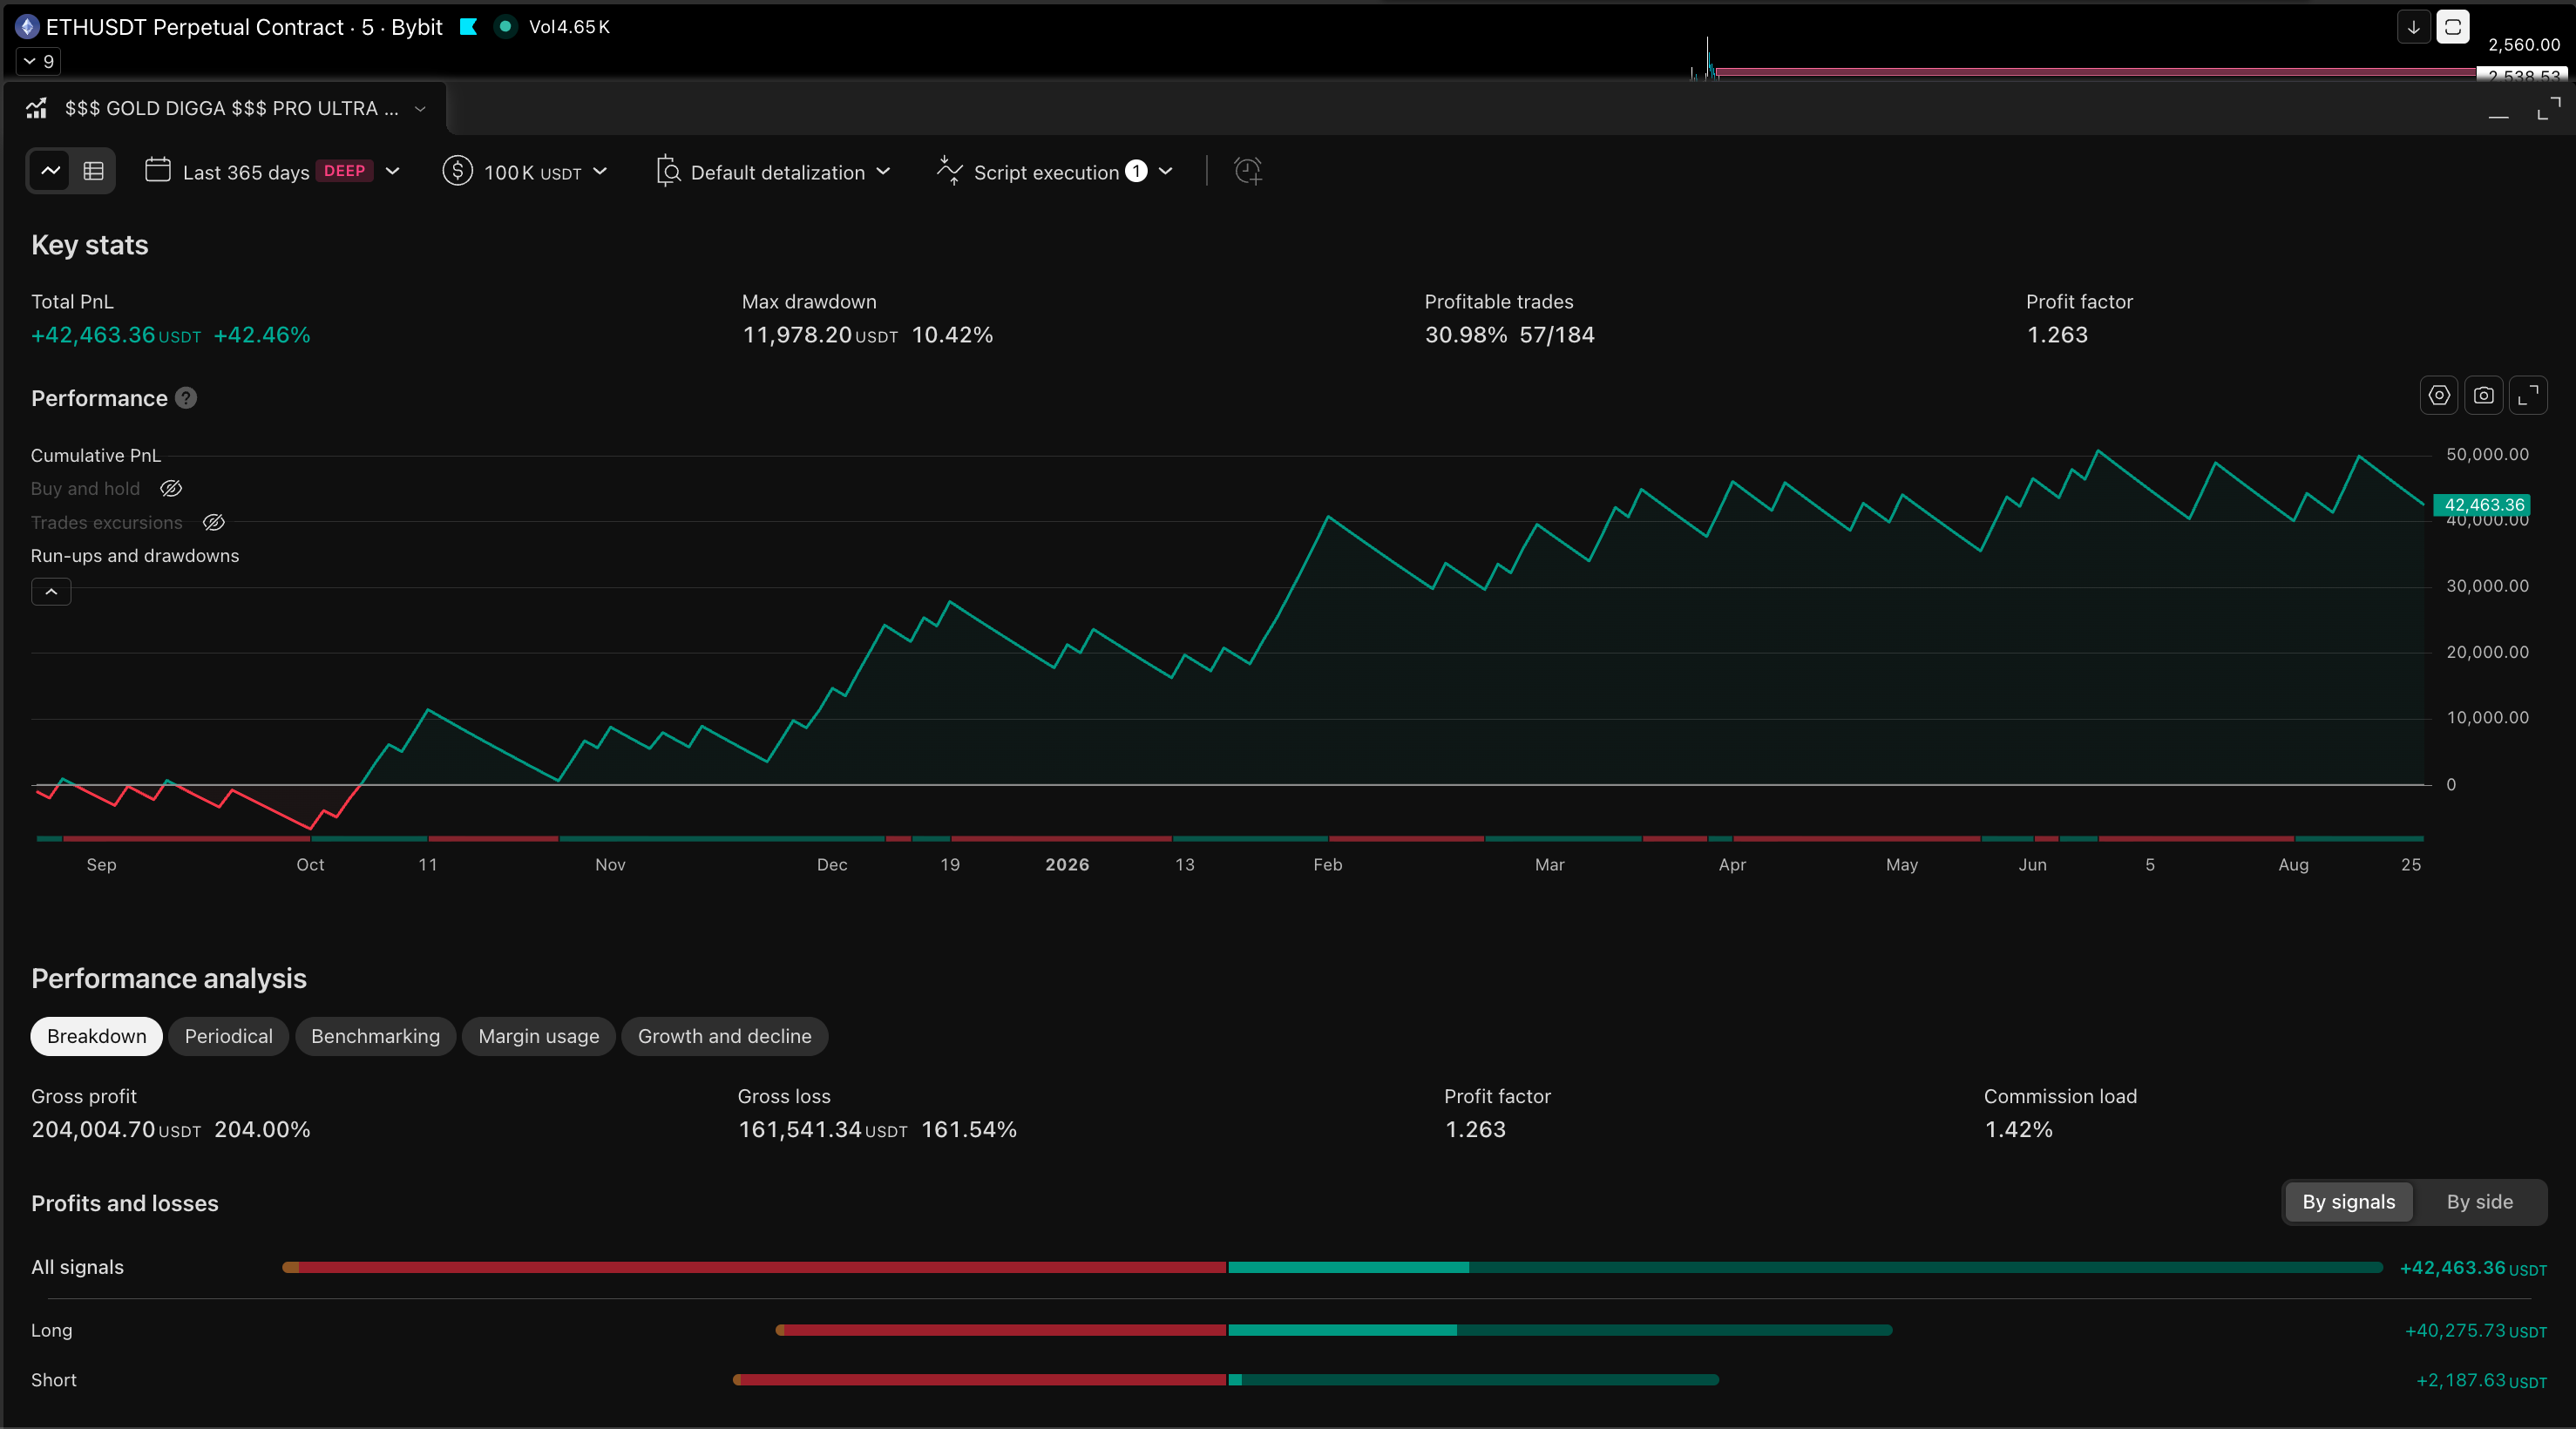
184 trades across the year, profit factor 1.26, maximum drawdown 10.4%, and just under a third of the trades profitable — the shape of a system that loses small often and wins large occasionally. Commission is charged and comes to 1.42% of turnover.
Almost all of it is on the long side — +40.3k against +2.2k short — in a year Ethereum rose, so it has not been shown to work in a falling one. The curve spends its first six weeks under water. And it is one instrument, over one year, measured by the people selling it.
Backtest results — past performance is not indicative of future results.
Four things that change what you see
A confirmed setup arriving while a position is open is skipped by design. On-chart marks will always outnumber the tester's trades: the chart shows every valid setup, the tester shows what a single-position account could actually have taken. If the two counts disagree, that is why.
Order size, starting capital, commission and slippage all live there and all move the results. Compounding especially: left on, it inflates a year's figures by a quarter and the equity curve stops being comparable to anything. If your numbers do not match what you expected, check Properties before you check the settings.
Without it the tester fills orders at bar boundaries and a stop and a target inside the same candle resolve by assumption rather than by data. Turn it on, and read the bar count it reports — a window it could not reach is a window with no result in it.
A percentage built on fifteen trades is an anecdote whatever it says, and a strong number from a short window is usually the window. Look at how many trades produced the figure, then at how long they took, and only then at the figure.
A measurement you can keep, load and hand over.
A finished configuration travels as one line of text. That is what stops good work being trapped on one person's chart.
Tune a symbol nobody has tuned, on the bench, under the protocol above — then export the result as a preset string and load it back in one field.
Name your favourite asset and we measure it — one request every two months on ULTRA. It comes back as the same one line of text, from the same protocol.
PRESET DIGGA reads a string back in full — who built it, on what, and every threshold it carries — without applying a thing. A string that has been altered or truncated is rejected rather than half-loaded.