GOLD DIGGA PRO
Five measured lane configurations, running in parallel. Visual settings only.
GOLD DIGGA PRO with ZONE DIGGA and REGIME DIGGA beside it: €20/mo, or €168/yr billed annually. 10-day free trial.
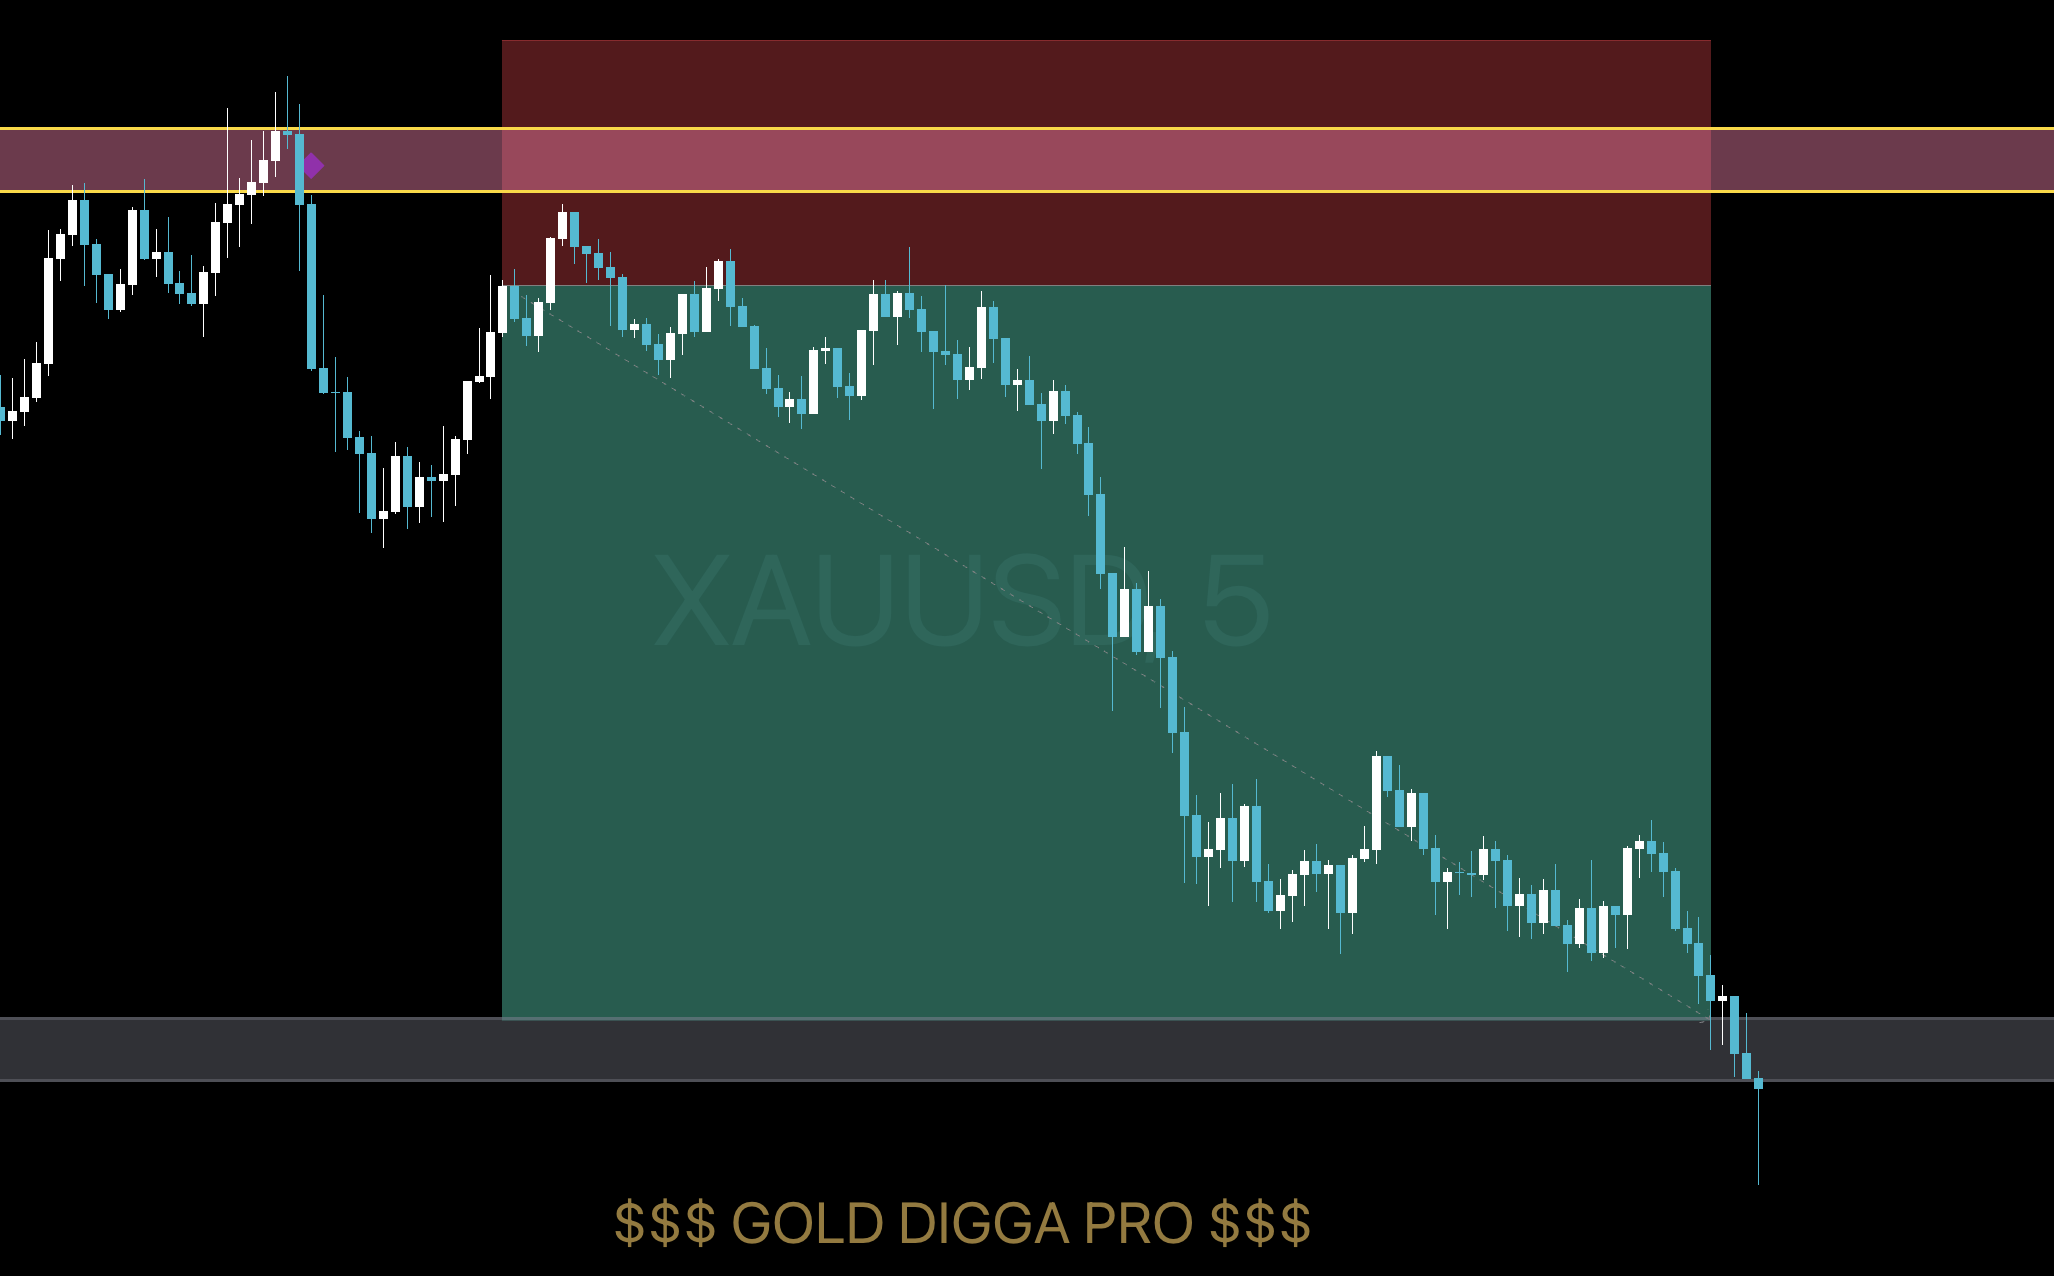
GOLD DIGGA PRO is the finished instrument. Every lane it runs was tuned and measured on its own — one lane, one timeframe, one configuration — and PRO runs them all in parallel: three on the five-minute chart, two on the fifteen. A diamond only prints when its own lane’s rules pass.
You control how it looks and which lanes alert you. How each lane decides was measured, and stays fixed — building and measuring your own is what PRO ULTRA is for.
What you get
- Five tuned lanes — Regulars, Scalps and Magic on 5m; Regulars and Scalps on 15m
- Each lane runs its own brain — regime verdict, session filter, cooldowns
- Per-lane alerts carrying the trade itself — size, entry and stop arrive in the message
- Trade levels on every diamond — entry, stop, two targets, lot size
- Backtested lane by lane on a year of gold — the results are on this page
- Visual customisation of every colour, box and label
What it did, and what it did not.
Every configuration measured on its own, and then run again on years no tuning decision ever touched. 1 of 7 held. The ones that did not are here too, ranked by that second column rather than the first — which is the only order that cannot be gamed.
| Tuning window | Never tuned on | |||||
|---|---|---|---|---|---|---|
| Configuration | Net | PF | Net | PF | Trades | Verdict |
| Gold Scalps 15m Jan 2022 – May 2025 | +29,700 | 2.22 | +47,090 | 1.371 | 183 | held |
| Gold Regulars 5m Jan 2022 – May 2025 | +21,500 | 2.24 | +37 | 1.001 | 67 | flat |
| Gold Regulars 15m Jan 2022 – May 2025 | +13,100 | 2.66 | −1,322 | 0.931 | 25 | flat |
| MGC Magic v1 15m Jan 2022 – Aug 2025 | +38,800 | 3.09 | −2,597 | 0.959 | 91 | flat |
| MGC Scalp v1 5m May 2022 – Aug 2024 | +56,600 | 1.87 | −12,932 | 0.844 | 115 | lost |
| Gold Magic 5m Jan 2022 – May 2025 | +43,900 | 1.81 | −41,482 | 0.809 | 311 | lost |
| Gold Scalps 5m Jan 2022 – May 2025 | +25,100 | 2.76 | −53,791 | 0.534 | 135 | lost |
Fixed position sizing, $100,000 account, 1% risk per trade, no compounding — never a percentage of the account as it stands. A configuration that fails on old data is ambiguous: it may be over-fitted, or that market may simply have been a different game, and this test cannot tell those apart. One that works in both structures is not ambiguous. Backtest results; past performance is not indicative of future results.
Price returns to where orders were left behind.
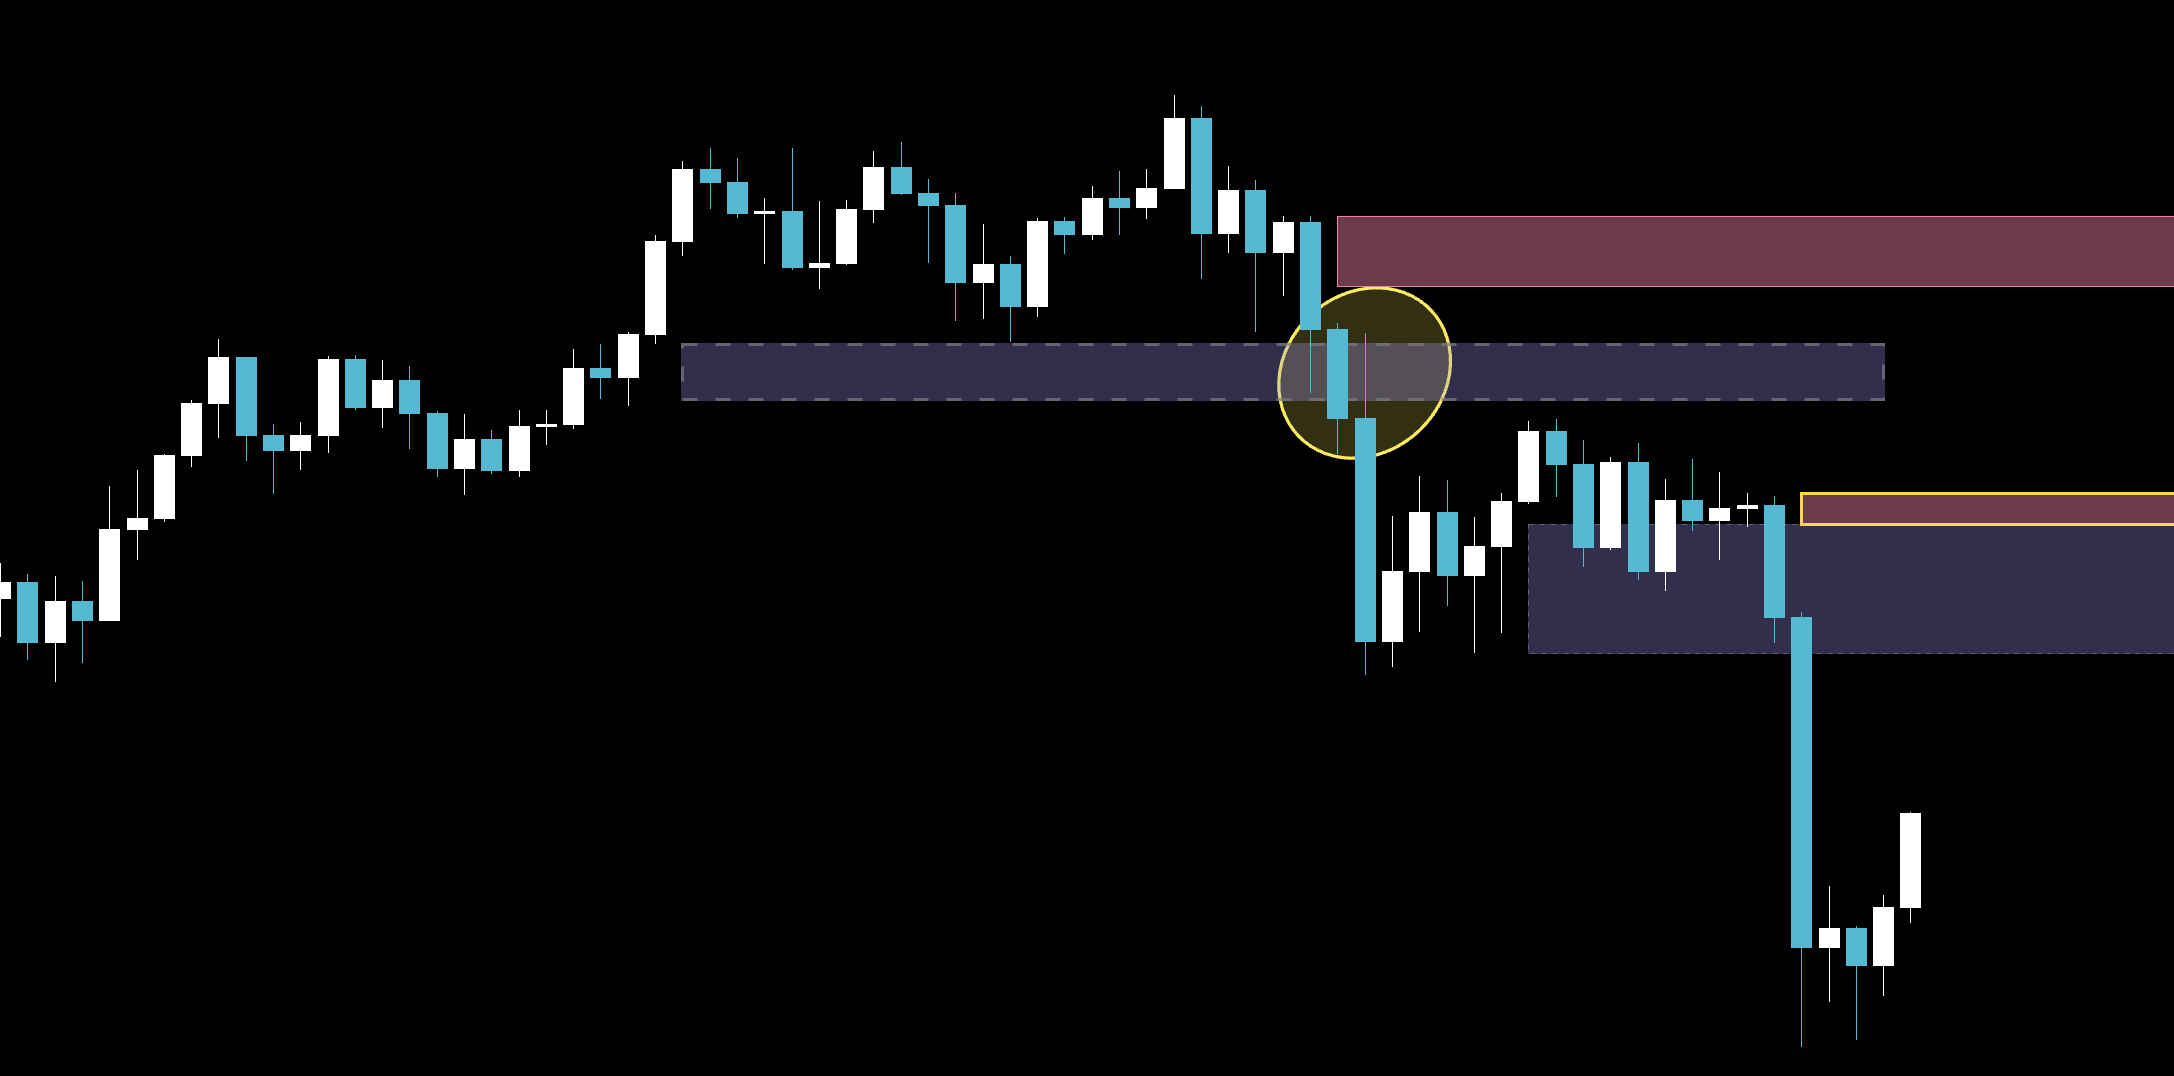
That is the whole idea underneath. A few levels on any chart are the ones large orders were actually filled at, and price keeps coming back to them — first to trade there again, and later, if the level gives way, to collect everybody who defended it.
Most tools delete a broken level. This one turns it around.
Everyone who bought that zone as support is offside the moment it breaks. Their stops sit just beyond it and their exits are orders in the opposite direction, waiting. When price comes back to it from below, it is no longer a floor — it is a queue of people who want out at breakeven.
The engine keeps that level, flips it, and keeps alerting on it. A broken block is removed only once it has genuinely been consumed, rather than the moment price closes through it — which is precisely when it becomes interesting.
Each one measured on its own.
Five lanes. Five measurements.
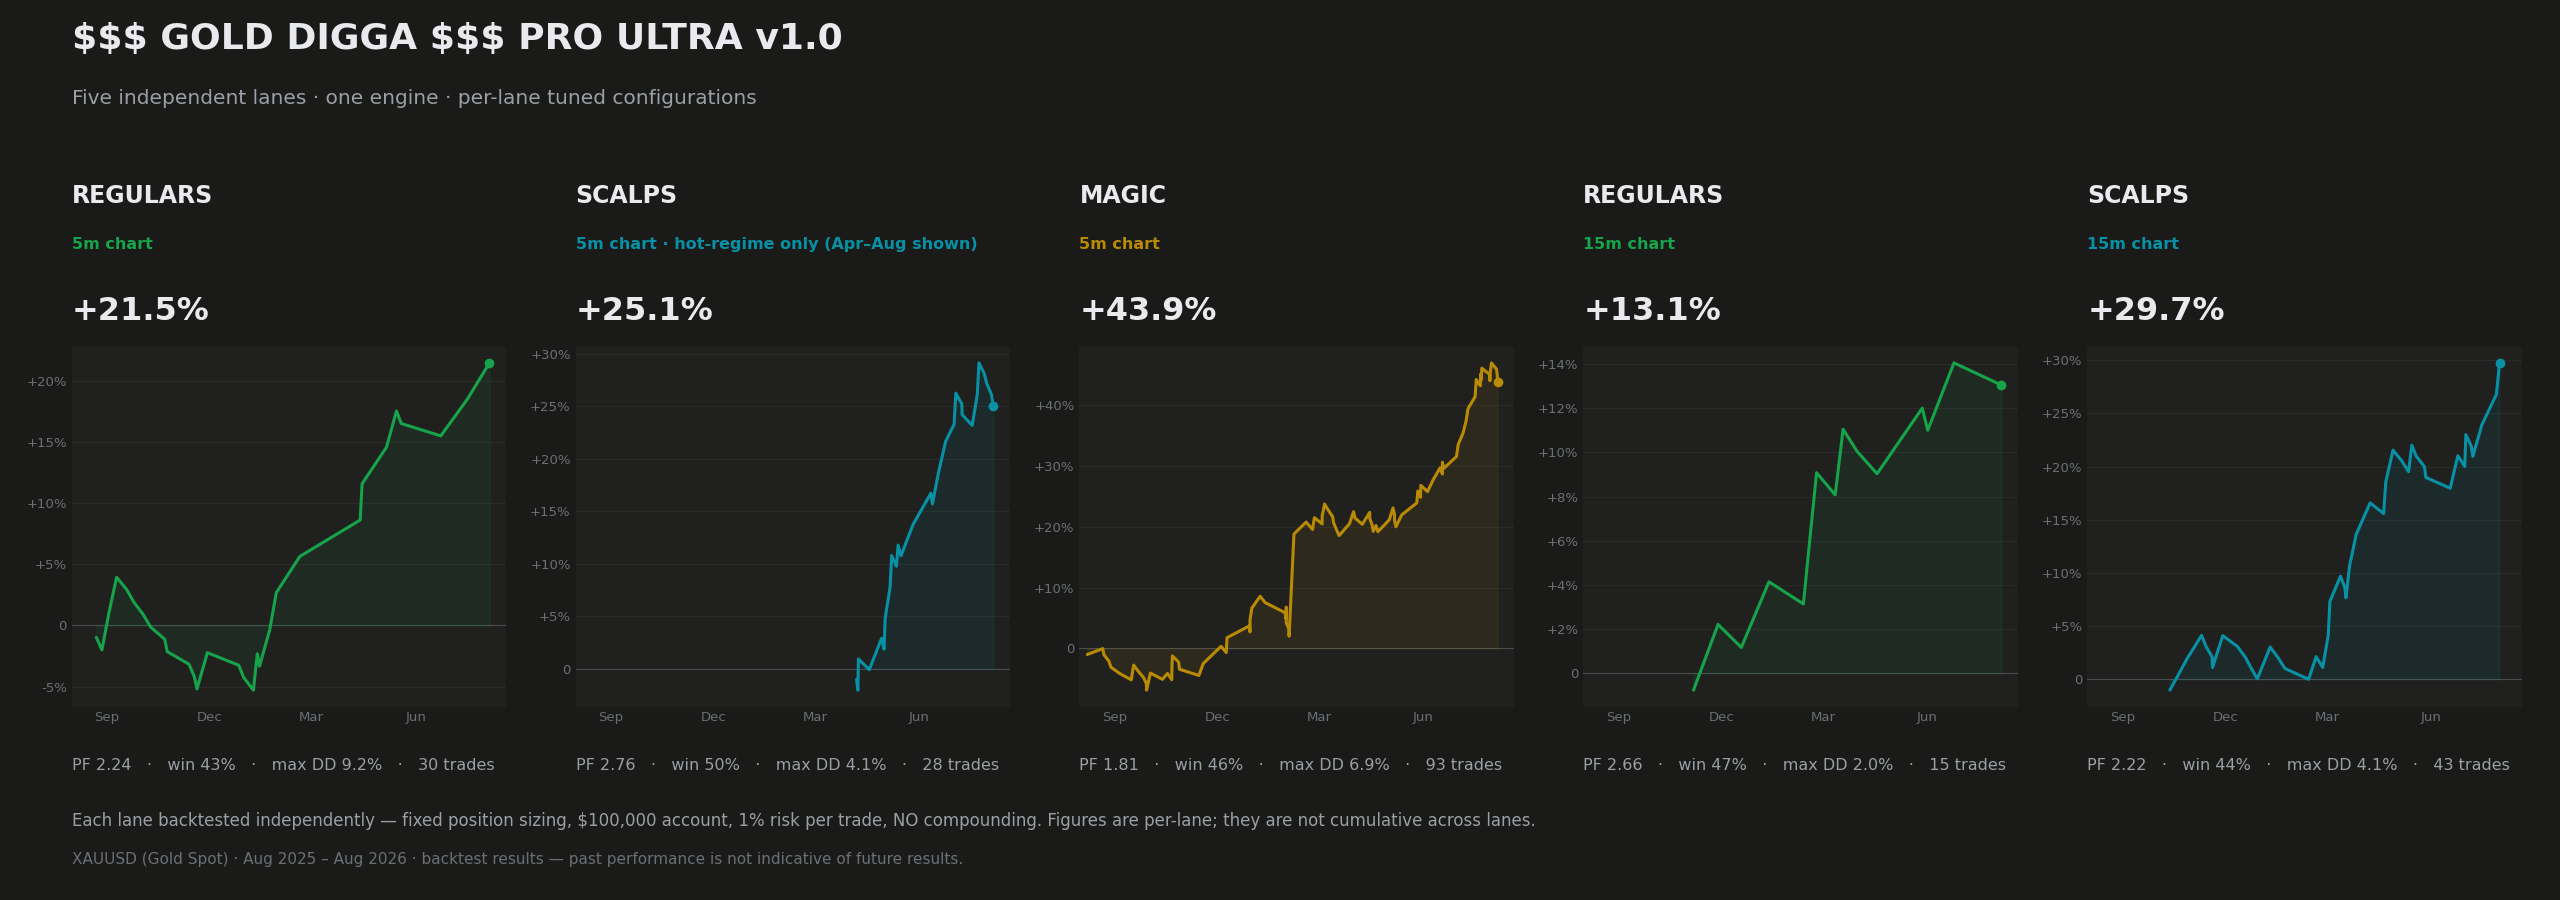
Every configuration PRO runs was measured on its own — one lane, one timeframe, the same twelve months of gold: Aug 2025 – Aug 2026.
| Lane | Chart | Net | Profit factor | Win rate | Max drawdown | Trades |
|---|---|---|---|---|---|---|
| REGULARS | 5m | +21.5% | 2.24 | 43% | 9.2% | 30 |
| SCALPSHot-regime only — Apr–Aug shown | 5m | +25.1% | 2.76 | 50% | 4.1% | 28 |
| MAGIC | 5m | +43.9% | 1.81 | 46% | 6.9% | 93 |
| REGULARS | 15m | +13.1% | 2.66 | 47% | 2.0% | 15 |
| SCALPS | 15m | +29.7% | 2.22 | 44% | 4.1% | 43 |
One line in that table needs explaining rather than a badge. SCALPS 5m takes trades only in a hot regime, so although it was run across the same twelve months as the rest, it produced trades in a stretch of them — the months shown beside it. It is the same test window, not a shorter one, and the lane sitting out the quiet part of the year is the behaviour it was built for rather than a period chosen after the fact.
Each lane measured independently — fixed position sizing, $100,000 account, 1% risk per trade, no compounding. Figures are per-lane; they are not cumulative across lanes. XAUUSD (Gold Spot), Aug 2025 – Aug 2026. Backtest results — past performance is not indicative of future results.
Worth saying plainly: that year was a strong uptrend in gold. These lanes read structure rather than predict it, but a year that trends less will not hand back numbers like these, and nobody should buy expecting it to. Read the trade counts too — the smallest lane here closed 15 trades, which is a sample, not a track record.
We measured them outside the year we tuned them.
A backtest of the same months a configuration was built on will almost always look good. The only figure worth anything is what those exact settings did on data no tuning decision ever touched — so that is published here too, wins and losses together.
Those five lanes were tuned on the same twelve months they are measured over. That is normal practice, and it is also the reason such tables tend to look good. So in August 2026 we ran them again on the years before that window — data no tuning decision ever touched. 1 of 5 held.
+47,090 · PF 1.371 · 183 trades · max drawdown 13,903 — positive in both halves of that span, and stronger in the later one (PF 1.154, then 1.543) rather than fading.
The other lanes did not reproduce, and we are not going to dress that up. What it means is genuinely open: they may be over-fitted to the recent year, or the market of 2022–2024 may simply have been a different game — this test cannot tell those two apart. It is also why the lane that passed counts for more than five lanes measured only on their own year: a configuration that fails on old data is ambiguous, while one that works in both structures is not. Still a backtest, still one instrument, still not a promise about next year.
The same test was run on the crypto sleeves, and found one more that held:ETH 15m Scalps, +62,229 at PF 1.285 over Oct 2020 – Jul 2025, positive in both halves of that span. Two of the eleven catalogued presets reproduced outside their own window; the other nine are on the catalogue page with their numbers, not hidden behind the two that worked.
ENTRY, PRO and PRO ULTRA
| Capability | ENTRY | PRO | ULTRA |
|---|---|---|---|
| Every indicator in the catalogue | — | ● | ● |
| One PRO vehicle, your pick — GOLD, INDEX or CRYPTO | ● | ● | ● |
| ZONE DIGGA — psychological zones on any chart, any market | ● | ● | ● |
| REGIME DIGGA — what kind of market you are in, and how much to believe it | ● | ● | ● |
| The five measured gold lanes — 5m and 15m, running in parallel | ◐ | ● | ● |
| The measured crypto and index cells — BTC, ETH, the Nasdaq on both tapes | ◐ | ● | ● |
| Independent lanes, each with its own brain and its own alerts | ● | ● | ● |
| Trade levels on every setup — entry, stop, TP1, TP2, lot size | ● | ● | ● |
| Contract value detected automatically | ● | ● | ● |
| Visual customisation | ● | ● | ● |
| Help with setup and settings | ● | ● | ● |
| The subscriber Discord — announcements, setup help, shared charts | ● | ● | ● |
| A full backtest strategy — equity curve and trade list for every change | — | — | ● |
| Build and measure your own lane configurations, one lane at a time | — | — | ● |
| Ask for a preset for your favourite assetOne per 2 months | — | — | ● |
| Presets shared by other subscribersIn development | — | — | ● |
| PRESET DIGGA — read any preset string in full before you run it | — | — | ● |
| Direct help tuning it to your instrument and your risk | — | — | ● |
| Vision review — a model reads the chart and gives a second opinionIn development | — | — | ● |
| Every threshold unlocked | — | — | ● |
on ENTRY, for the vehicle you picked.
2 rows are markedIn developmentand they are not part of what a subscription gets you today. No price is set on them, and if neither ever ships the editions are still what every other row says they are. They appear here because it is worth knowing what is being built, not as a reason to buy.
What changed, version by version.
The three most recent of 9 notes for GOLD DIGGA PRO, as posted to subscribers. Open one to read it in full.
GOLD DIGGA PRO ver1.9 — the alert instance and the chart now see the same bars
GOLD DIGGA PRO ver1.9 — the alert instance and the chart now see the same bars
From one alert: a BUY on 18 September at 10:20 whose diamond never appeared. Not delayed — never.
The alert server and your chart were fed different bars. Every higher-timeframe read — the 15m order-block engine on a 5m chart, the regime trend, the 30m / 4H / daily slopes — returned the last closed bar on history but the open bar in realtime, tick by tick. The 15m engine runs on every 5m close, so in realtime it saw a half-formed 15m bar three times per period, and a block it found mid-bar went into its library for good. The alert instance runs realtime from the day you made the alert; the chart rebuilds from history on every load. Three days later they held different libraries — the 10:20 alert asked for 77,639, and the chart’s block at that price was born 55 minutes later with a different shape.
Fixed without touching history. Each read now keeps a value only once its bar has closed; until then it uses the previous bar — which is what history shows there. History is byte-identical to ver1.8: N/N diamond count on the same chart, readable as diamonds drawn in the Data Window. In realtime the alert instance now sees what the chart sees.
New — FILLED and EXPIRED alerts. A resting limit reports FILLED BUY limit Scalp @ … at the touch and EXPIRED … when its pending life runs out (cancel the manual order); a market entry reports FILLED on the diamond’s bar. Per-lane toggles apply.
Retired — the three per-lane alert conditions (Scalp / Regular / Magic). One alert per chart, “Any alert() function call”, carries signals, plans and fills.
No signal, lane or measured configuration changes. Delete and recreate your alerts as “Any alert() function call” — an old alert keeps running the ver1.8 snapshot, with the divergence.
GOLD DIGGA PRO ver1.8 — the alert and the diamond now agree
GOLD DIGGA PRO ver1.8 — the alert and the diamond now agree
From one report: an alert arrives, there is no diamond on the chart, and hiding the indicator and showing it again brings it back.
The order-block tooltip was evicting your diamonds. Pine allows a script 500 drawing labels and that ceiling cannot be raised. Every block carried one, so on a 5m chart the block library alone held 400 of the 500 — and past the ceiling the oldest go.
It had not earned the room. That label drew nothing; it only answered a hover. And its tooltip was written once when the block was born and never updated, so “Age: 0 bars” said zero on every block, forever, and “Distance” was frozen at that first bar. Age is the one number worth having there, and it was the broken one. The rest is on the chart already: the box is the range, its colour is the timeframe and direction, a faded block failed the filter, an FVG has its own box.
Gone, with 12 colour calls per block per bar that repainted invisible text. 400 labels freed on 5m, 200 on 15m. Same blocks, same signals. The breaker tooltip shared that label and goes too.
The alert was firing for trades PRO had already refused. A signal whose stop is wider than its lane’s maximum is skipped and draws no marker — but the alert fired ahead of that filter. Both are gated on the same thing now.
And the alert carries the trade — BUY · SIZE 0.42 · ENTRY 4098.10 · SL 4091.60 · LIMIT 12 bars — instead of the symbol and timeframe alone.
Also: levels stop going negative off-metal. The stop buffer and max-SL cap are gold dollars; on a 1.98 instrument the card printed SL −15.51450. They now carry as a fraction of price. Gold, MGC, silver, palladium and every sleeved symbol keep a factor of exactly 1 — nothing you run moves.
Recreate your alerts after updating. TradingView stores a snapshot of the script from when the alert was made, so old alerts keep running ver1.7.
correctionCorrection to the ver1.7 note — the proximity guard, measured
Correction to the ver1.7 note — the proximity guard, measured
The ver1.7 release led with a fix: PRO had never carried the untested-daily proximity guard, and the bench did. Two sentences in that note were wrong, and the second one in the expensive direction.
What it said: “Every sleeve you run was measured with that guard active” and “you will see fewer diamonds, and fewer is correct.”
What is true. Most sleeves, not every. Gold ships without sleeves, so one default served all of its lanes — and gold’s own measured strings disagree with each other:
gold 15m Scalps   olDailyProxOn=0   measured with the guard OFF
gold 5m lanes     olDailyProxOn=1   measured with it on, $25
MGC sheet         olDailyProxOn=1   measured with it on, $15
crypto sleeves    olDailyProxOn=1   measured on — never once fired
The 0 on the flagship line is not an oversight. ver1.7 overrode it.
The A/B, run today. ULTRA ver1.7, XAUUSD 15m, Scalps, deep backtesting, fixed sizing. The control reproduces the published row’s fingerprint — drawdown 13,903.42 to the cent, 188 trades, 31.91% win — so it is the same bench.
                     net        PF   trades
OFF             +45,567.37   1.351     188
ON  $25          −2,520.13   0.954      72   Jan 2022 – May 2025

OFF             +13,466.57   1.319      60
ON  $25          +7,378.36   1.188      54   Jul 2025 – Aug 2026
116 of 188 trades removed, and +45,567 becomes −2,520.
$25 is 0.63% of gold near 4,000. On a 15-minute chart price is nearly always within 0.63% of some untested daily level, so a rule blocking every entry heading into one blocks most entries. It stops being a filter and becomes a muzzle.
(continues)