Smart money leaves a trail.
We dig it up.
TradingView indicators for gold, crypto and the Nasdaq. Order blocks from two timeframes, the levels price keeps coming back to, and entry, stop, targets and a lot size on every setup. PRO and ULTRA cover all of them — and whatever ships next.
Every configuration measured on its own — its own symbol, its own timeframe — and the ones that failed are published beside them.
Nothing charged for 10 days · Cancel anytime · A free TradingView account is enough
Prepare, and watch the market unravel.
Zones are drawn while nothing has happened yet. What price does with them afterwards is the whole test.
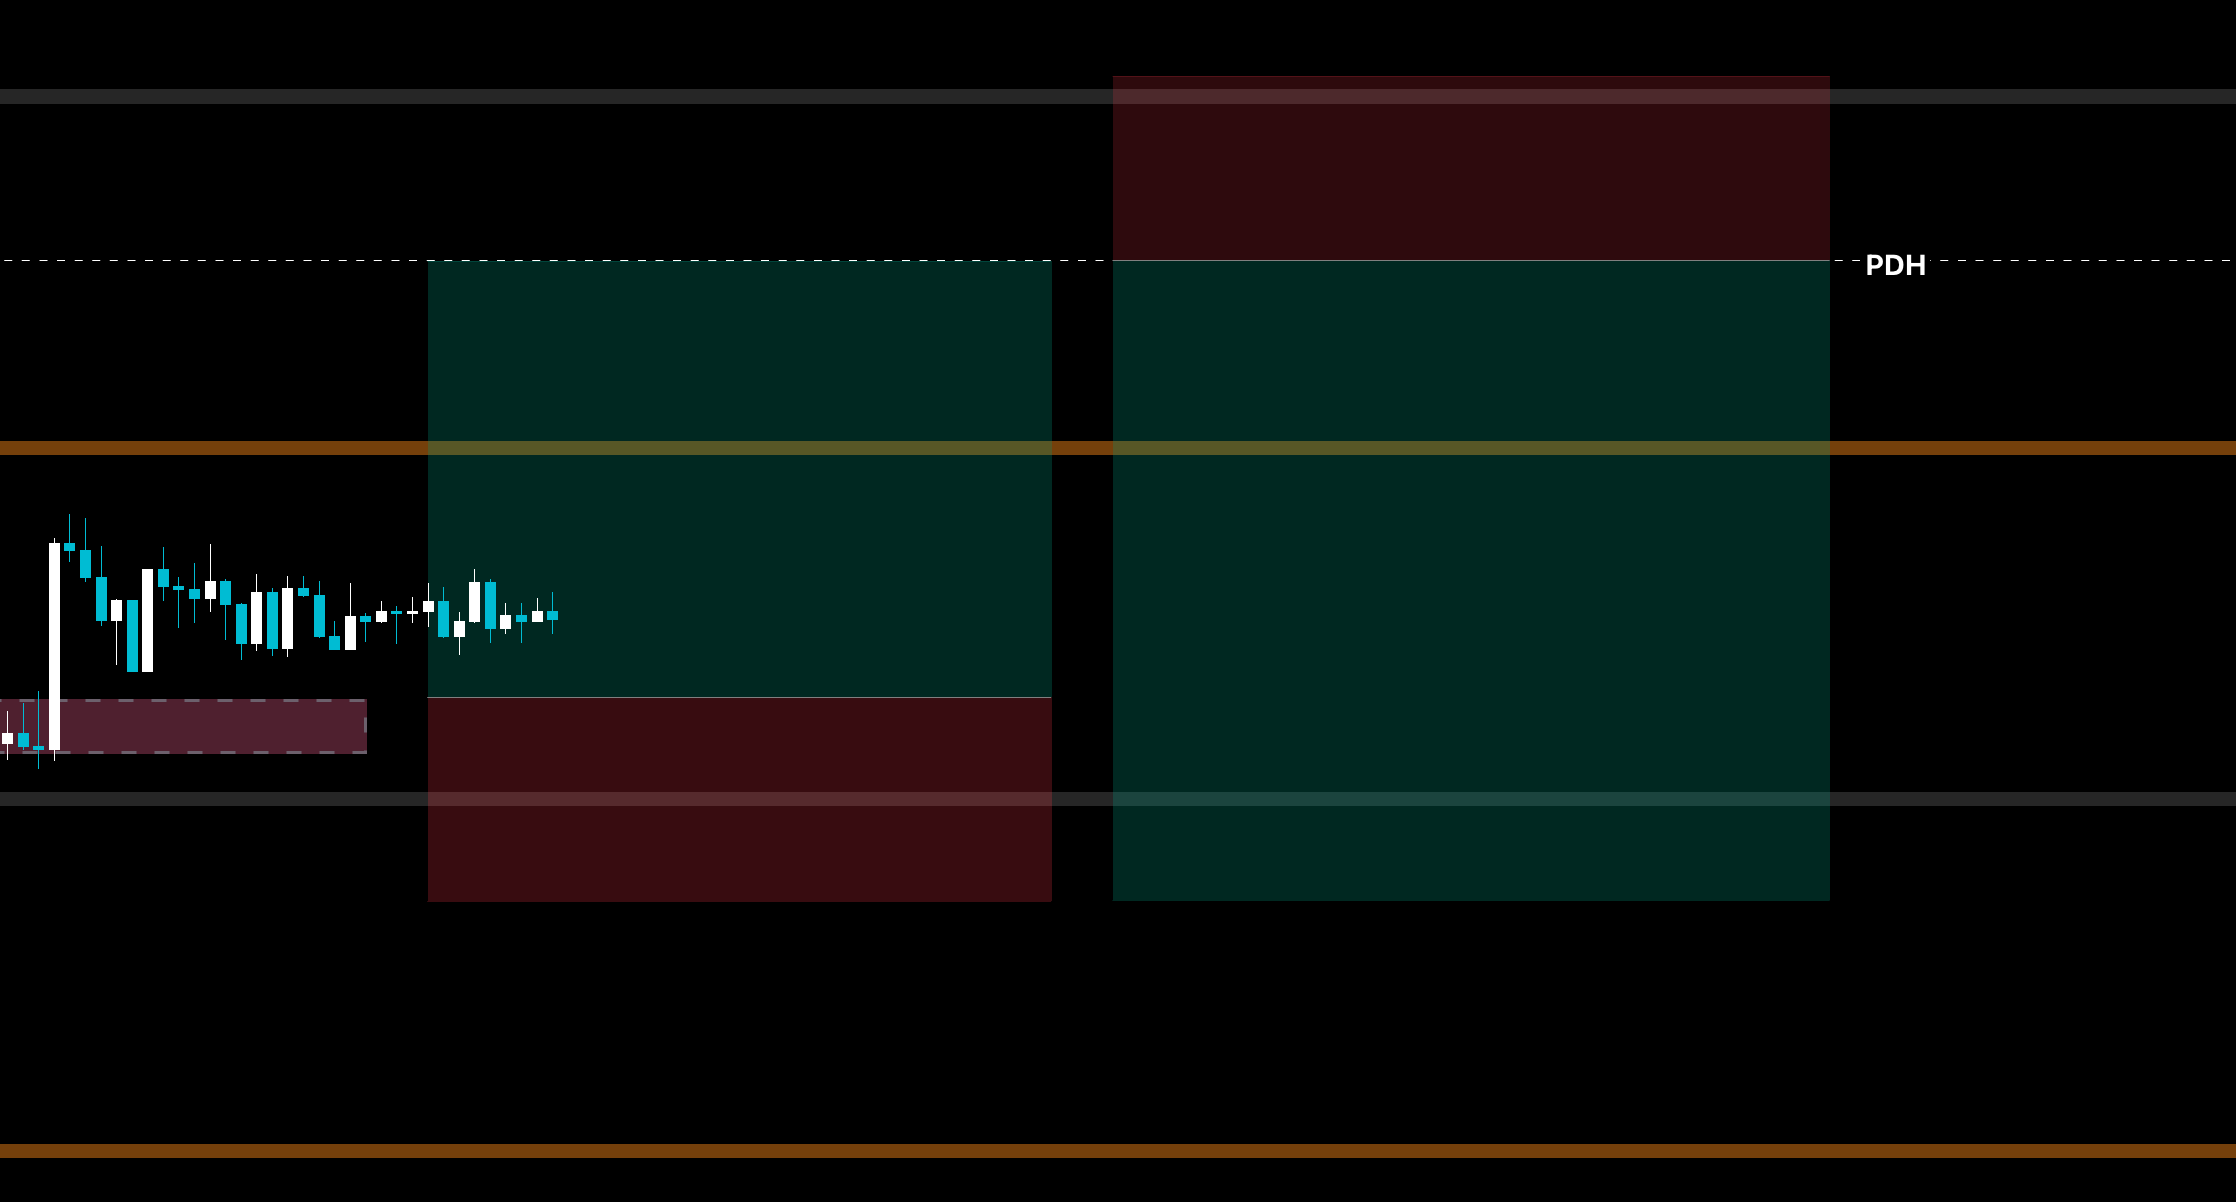
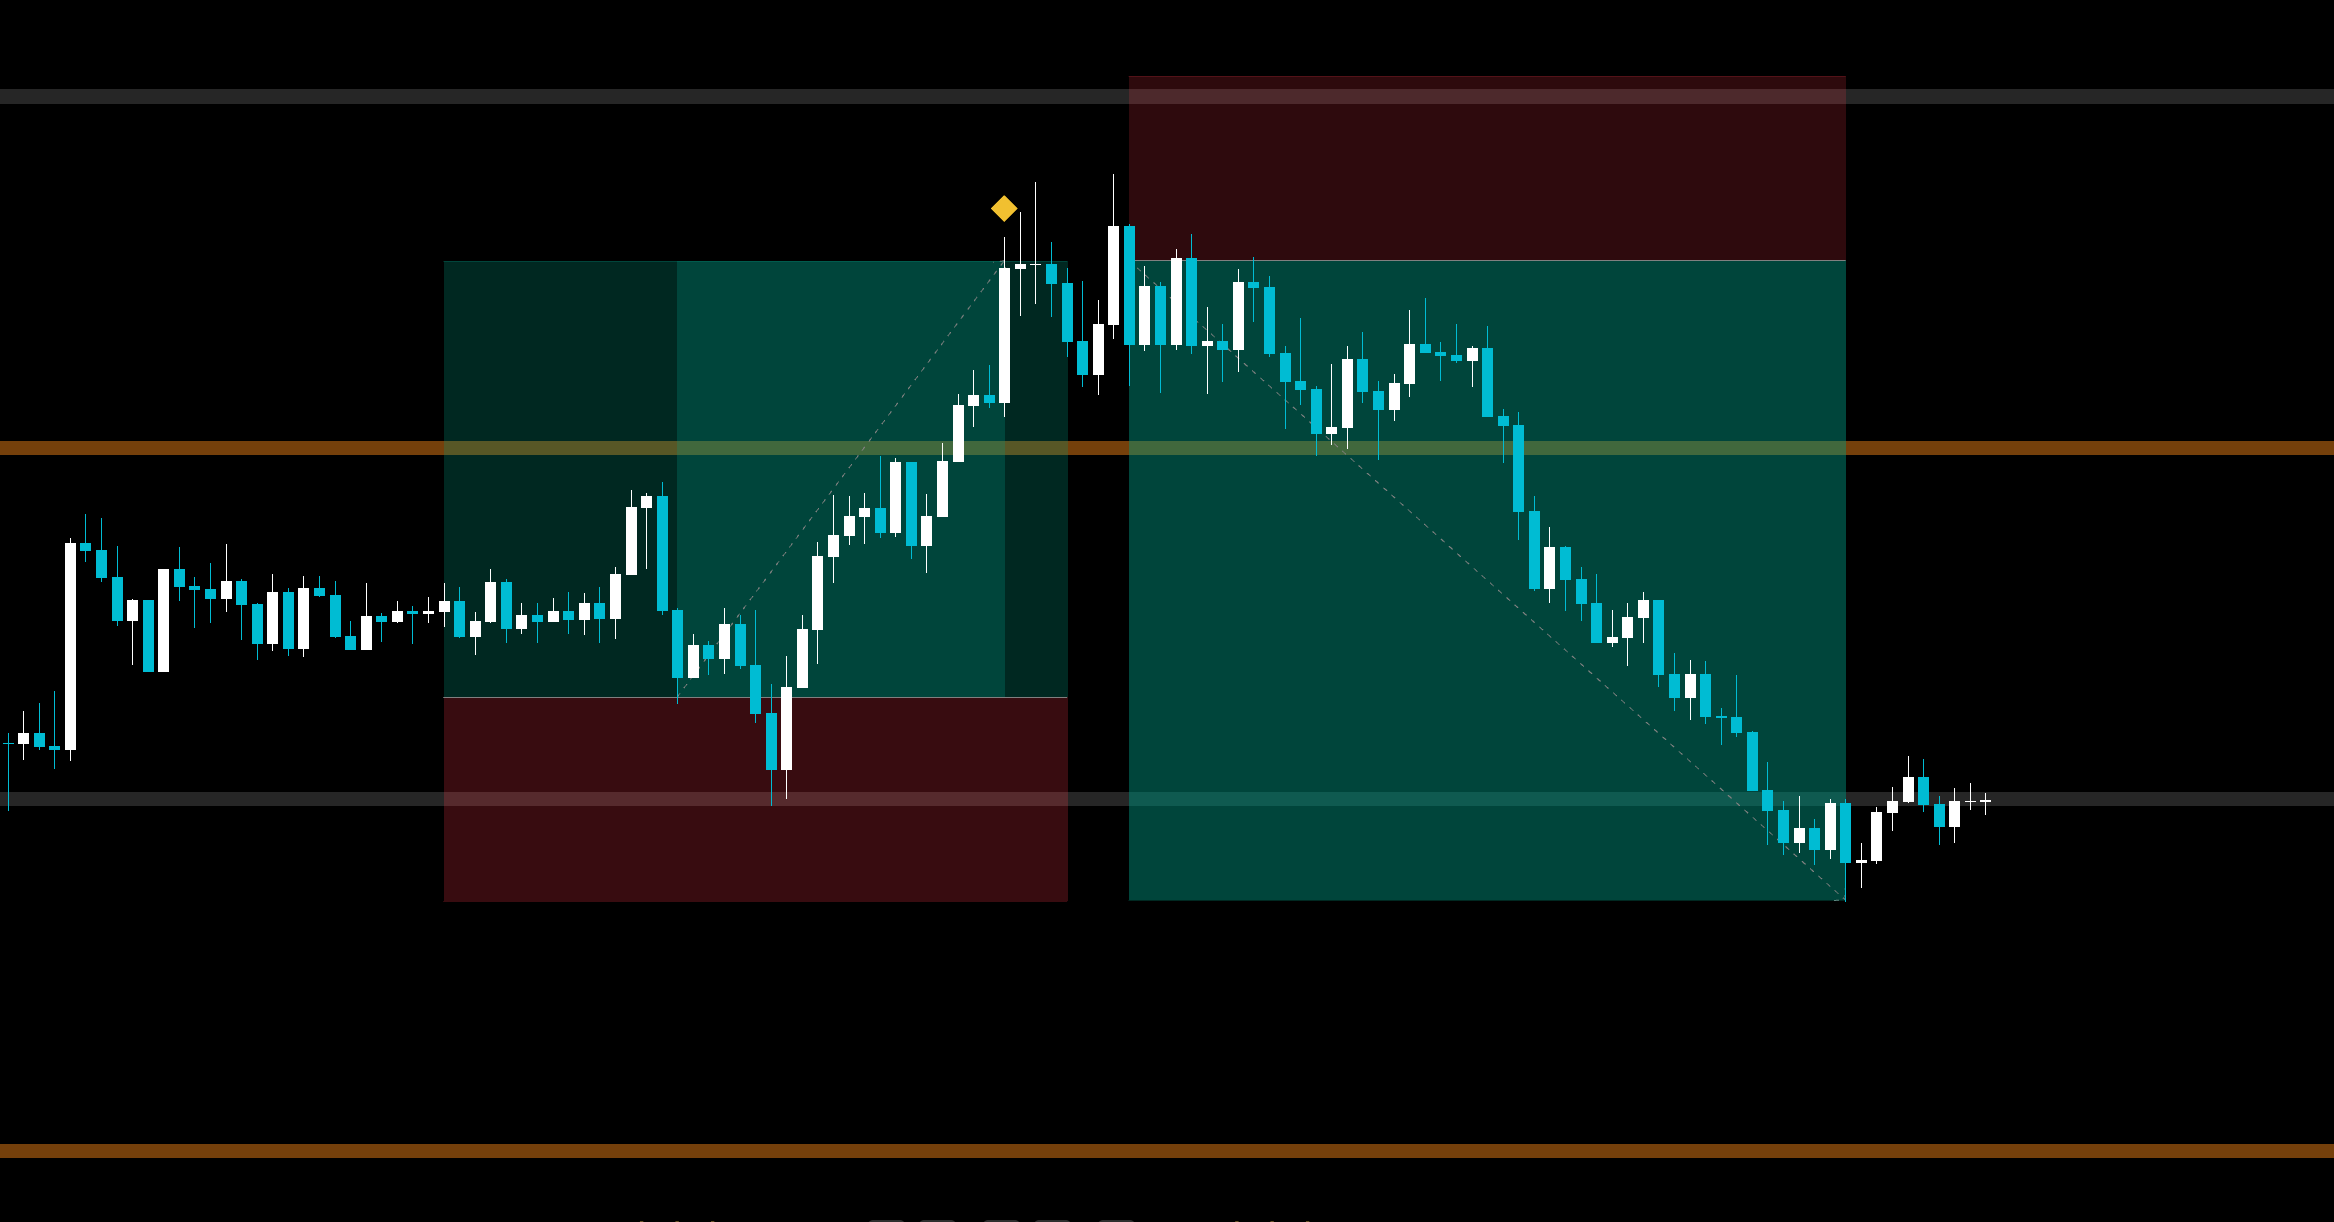
There is no buy signal in here and no setting that creates one. The engine finds where orders were left behind, draws the levels, prints the entry, stop, targets and size that go with them — and stops there, because the last call is the one that should be yours.
That is the design rather than a limit on it. A tool that decided for you would be one you could never check, and you would be trusting it exactly as blindly on the day it stopped working. What this replaces is the hour of marking levels by hand, not the judgement you bring to them.
Annual saves 30%. The first 50 pay €250 a year.
PRO and ULTRA are the whole catalogue — every indicator, and every one released after you subscribe, at no extra cost. ENTRY is one vehicle of your choice with ZONE DIGGA and REGIME DIGGA, €20 a month, less on annual. The founding rate is the whole catalogue at ULTRA level for €250 a year, and it never rises for as long as your subscription runs.
Every indicator in the catalogue, PRO edition. The measured lane configurations run in parallel; the visuals are yours to set.
Every indicator in the catalogue, PRO edition. The measured lane configurations run in parallel; the visuals are yours to set.
Annual saves €216
Every indicator in the catalogue, PRO edition. The measured lane configurations run in parallel; the visuals are yours to set.
Annual saves $248
Every indicator in the catalogue, PRO edition. The measured lane configurations run in parallel; the visuals are yours to set.
Every indicator, ULTRA edition. The tuning bench: a full backtest strategy, every threshold live, any symbol — PRO included.
Every indicator, ULTRA edition. The tuning bench: a full backtest strategy, every threshold live, any symbol — PRO included.
Annual saves €360
Every indicator, ULTRA edition. The tuning bench: a full backtest strategy, every threshold live, any symbol — PRO included.
Annual saves $413
Every indicator, ULTRA edition. The tuning bench: a full backtest strategy, every threshold live, any symbol — PRO included.
€250 a year for the first 50. After that it is €100 a month. Our thanks to the early supporters: everything at ULTRA level, available now or released later, and the price never rises for as long as your subscription runs.
$287 a year for the first 50. After that it is $115 a month. Our thanks to the early supporters: everything at ULTRA level, available now or released later, and the price never rises for as long as your subscription runs.
Every figure is the final price, VAT included — nothing is added at checkout. Sold through Whop (merchant of record). 10 days free first; starting access immediately waives the 14-day right of withdrawal —terms.
Dollar figures are an indication only, converted at 1.148 as of 2026-09-19. Every subscription is charged in euro, and your bank sets the rate on the day.
How to buy (requires a Whop account) →The measured one. Gold, lane by lane.
Five lanes on gold, each measured on its own
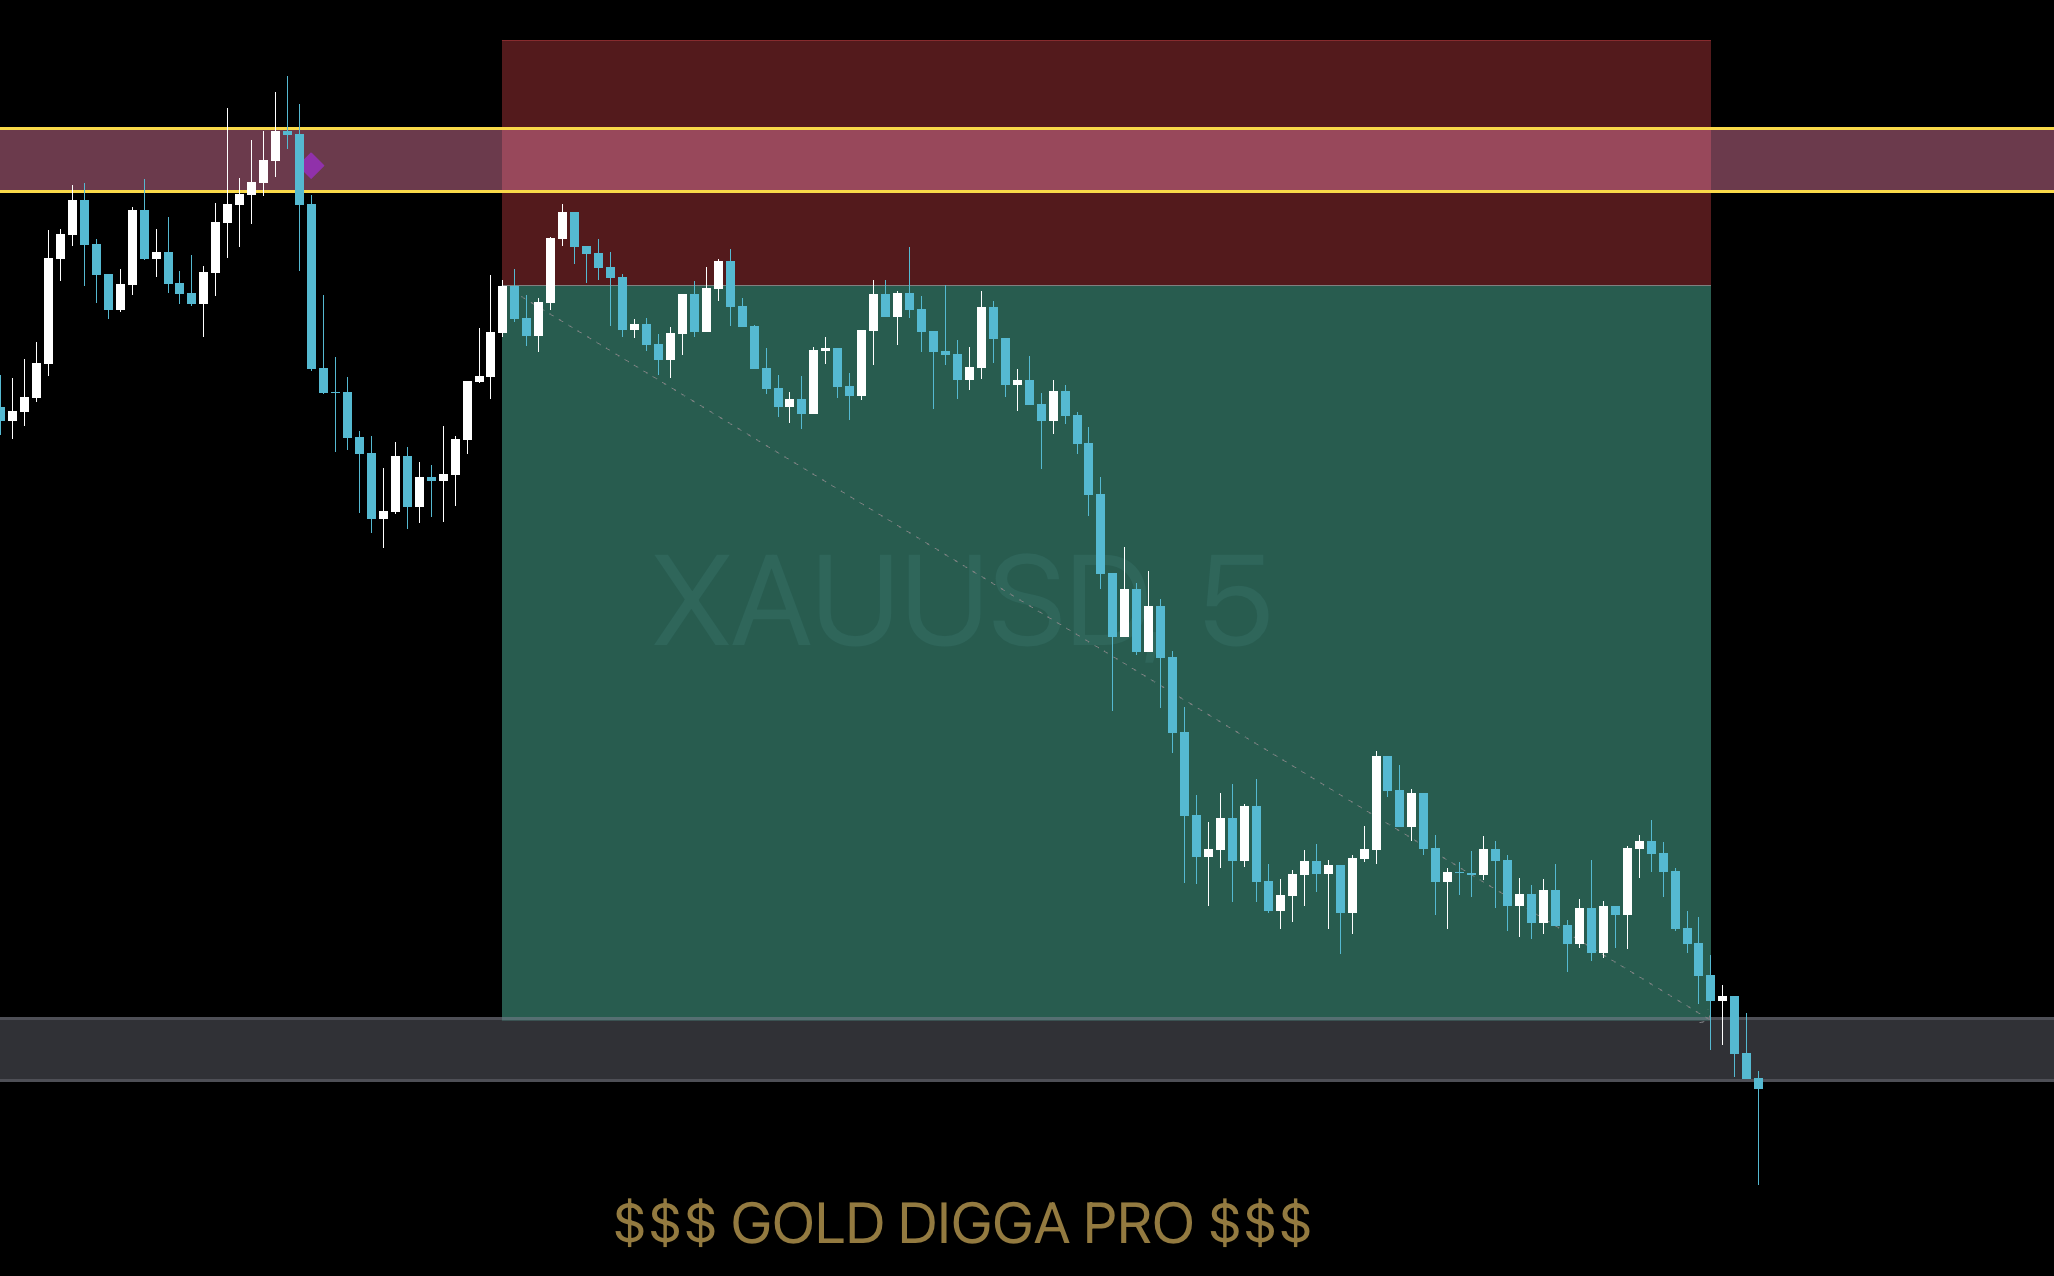
Everything the trade needs is on the chart the moment the setup confirms and not a candle later. Red is what you stand to lose if it fails; green is what it is aiming at, ending on the level it was measured to. The lot size is worked out from the account size and risk percentage you typed in, so the number is yours rather than a default somebody else chose.
- Five lane configurations — Regulars, Scalps and Magic on 5m; Regulars and Scalps on 15m
- Each lane carries its own brain — trend timeframe, ADX gate, session filter, cooldowns
- Gold spot and Micro Gold futures, each running only the lanes measured on it
- Entry, stop, two targets and lot size drawn on every confirmed setup
- Per-lane alerts, so one chart per timeframe carries the whole book
The same engine. Measured on crypto.
Built from finished measurements, not from settings
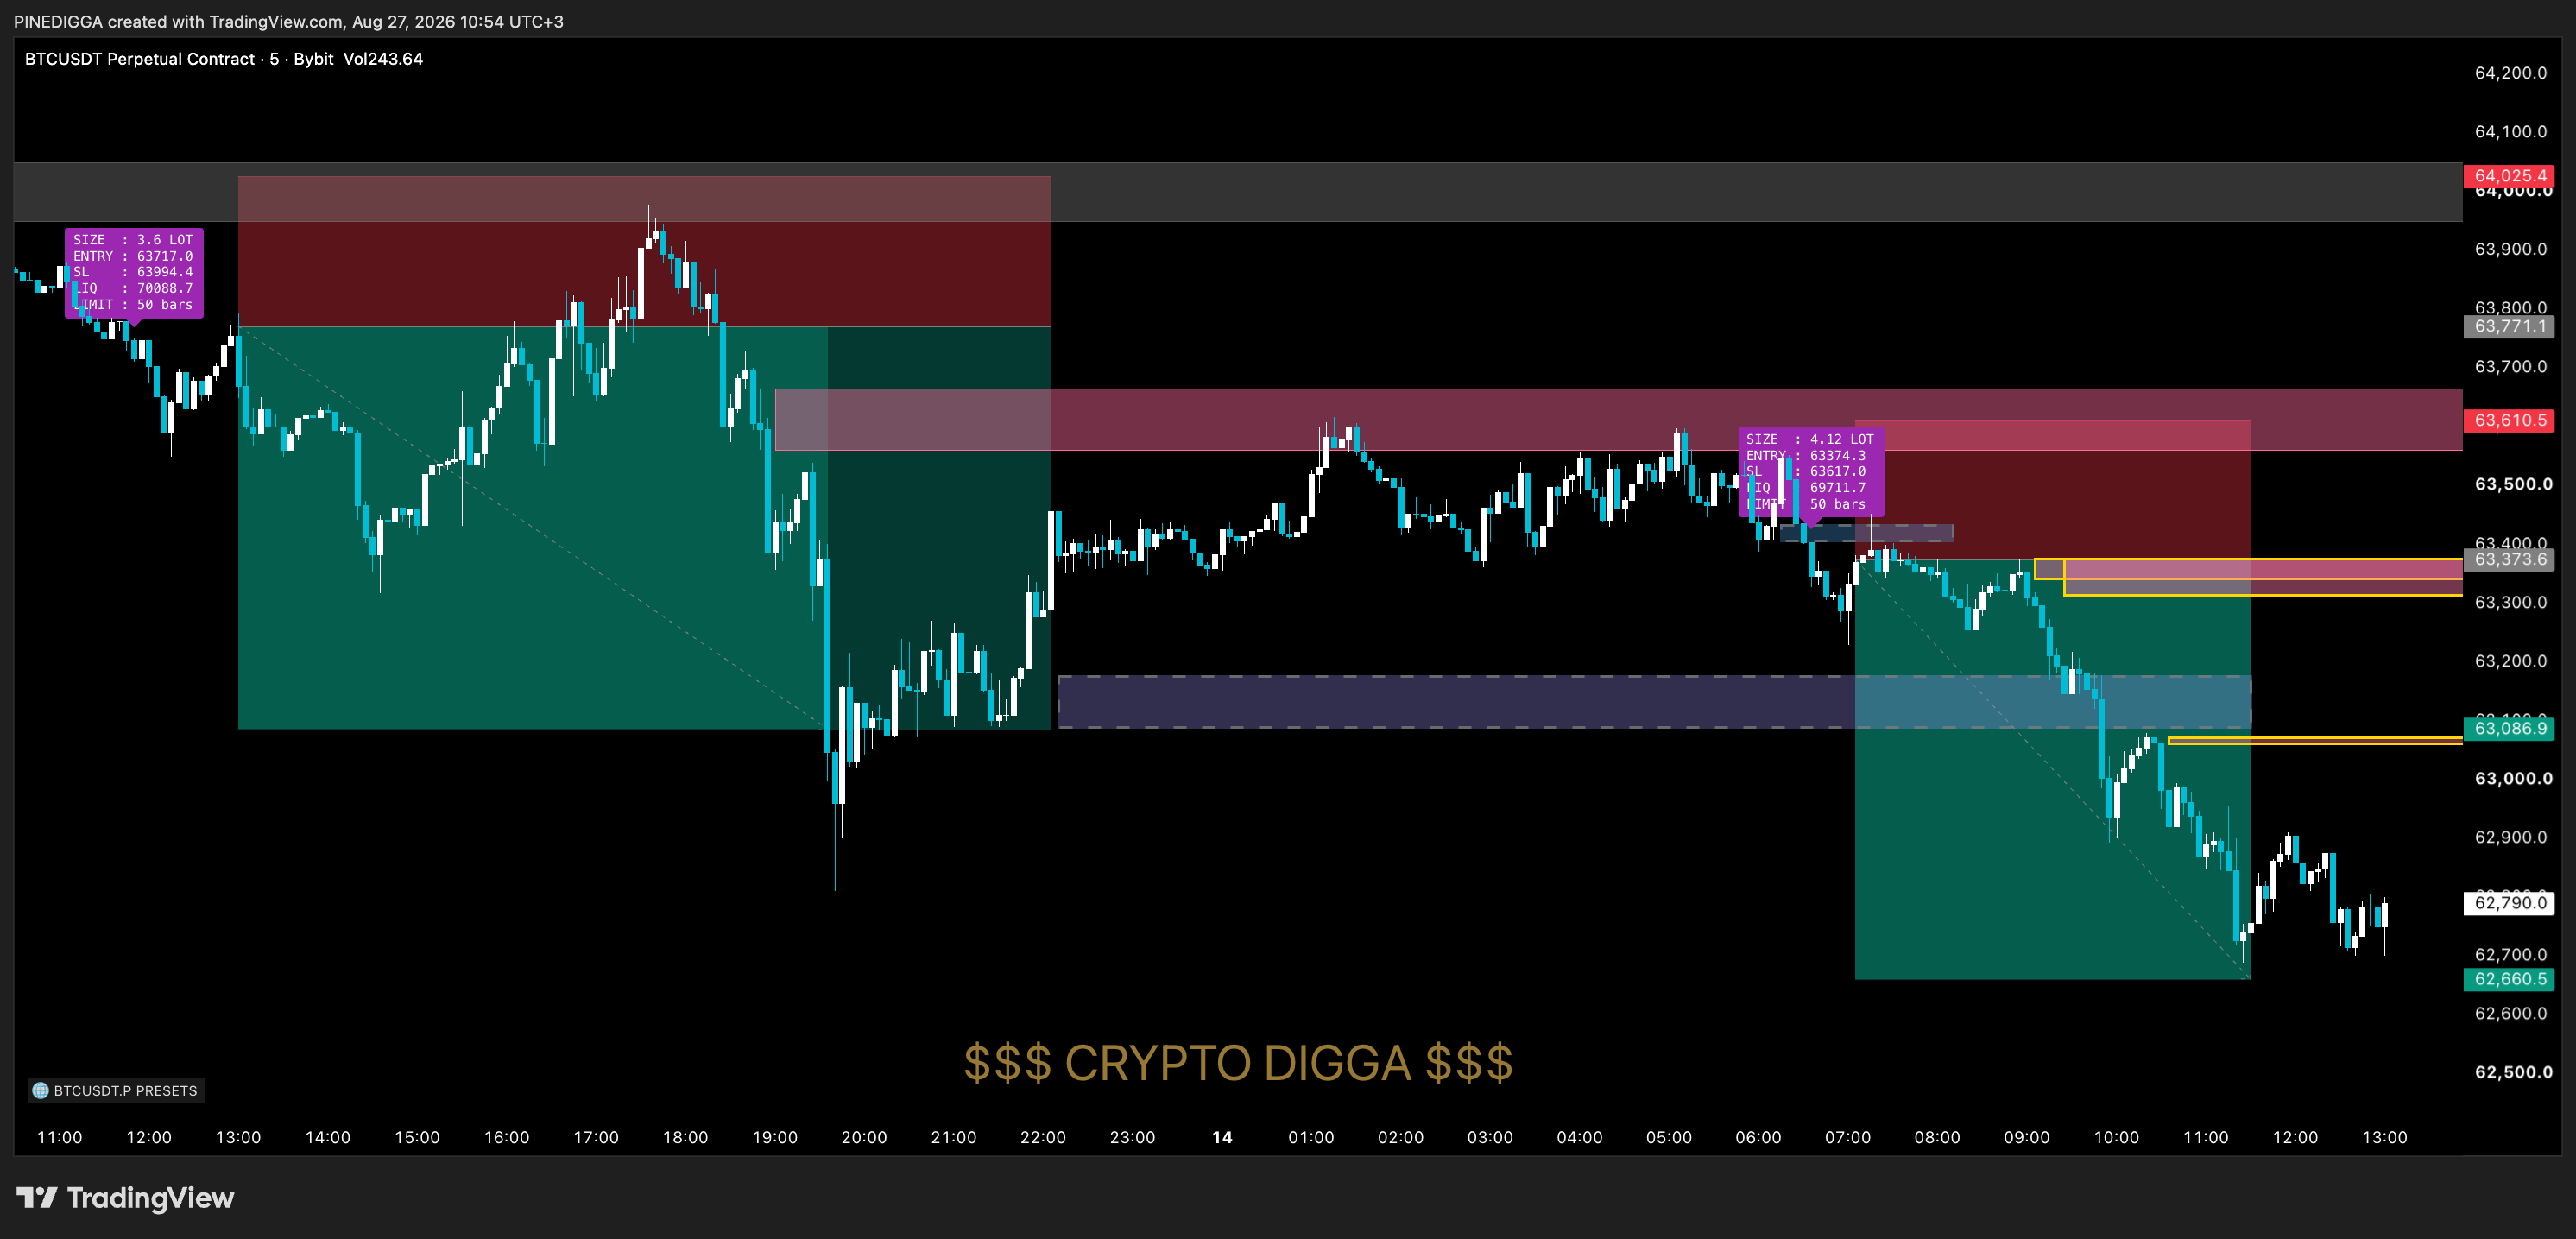
It is not one strategy with a menu. Each lane runs the exact configuration it was tuned and backtested with on its own symbol and timeframe — its own trend timeframe, its own ADX gate, its own session filter. What fired in the measurement is what fires on your chart, and a cell nobody measured stays silent rather than guessing.
- BTC and ETH built in, each sleeve running the configuration measured on it
- Every lane carries its own brain, rather than sharing one set of filters
- Nothing runs that was not measured — an unmeasured cell stays quiet
- Trade levels on every setup — entry, stop, two targets and a lot size for your account
- Any other symbol pastes in as a preset string, read back in full before it runs
The Nasdaq, on both of its tapes.
A setup that stands on two feeds is worth more than one
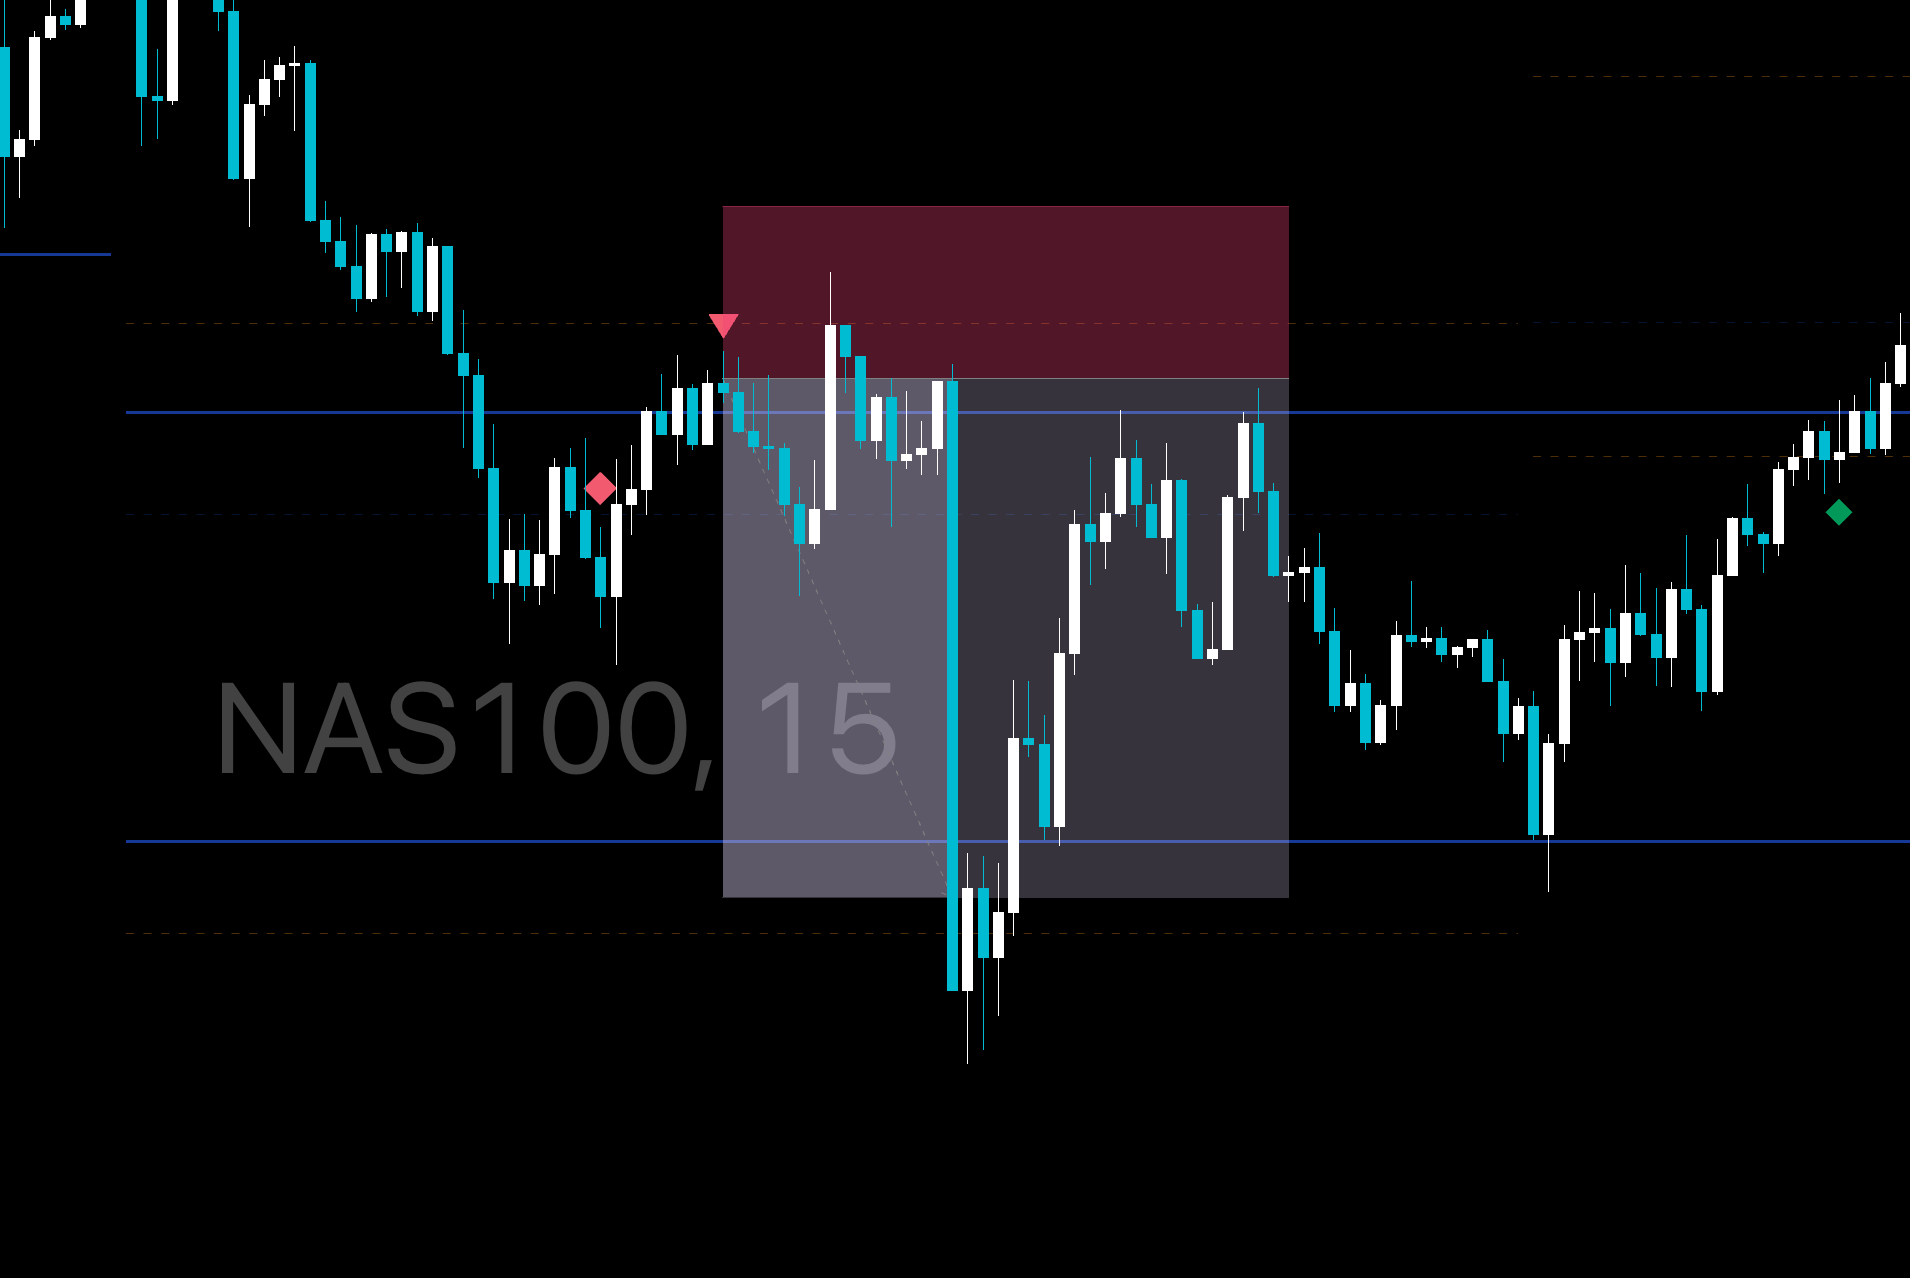
FX:NAS100 and the CME contract trade the same index at slightly different prices, on tapes that do not open and close together. Require a setup to appear on BOTH before a limit rests and, measured across three feeds, nine of nine combinations improved — and what it buys is drawdown rather than profit: on the futures cell the total barely moves while the ride roughly halves. It ships off by default, and it is ignored on gold, where the same rule was measured and loses.
- Three measured cells, picked by the symbol — Nasdaq futures, Nasdaq CFD, spot gold
- No lane dropdown and no preset selector — open the chart and its cell runs
- Require a setup to stand on both Nasdaq tapes before a limit rests
- Trade levels on every setup — entry, stop, target and a lot size for your account
- A table that says which cell is running and whether a pasted preset actually loaded
The levels that decide. On any market.
You are not the crowd. You are waiting for it.
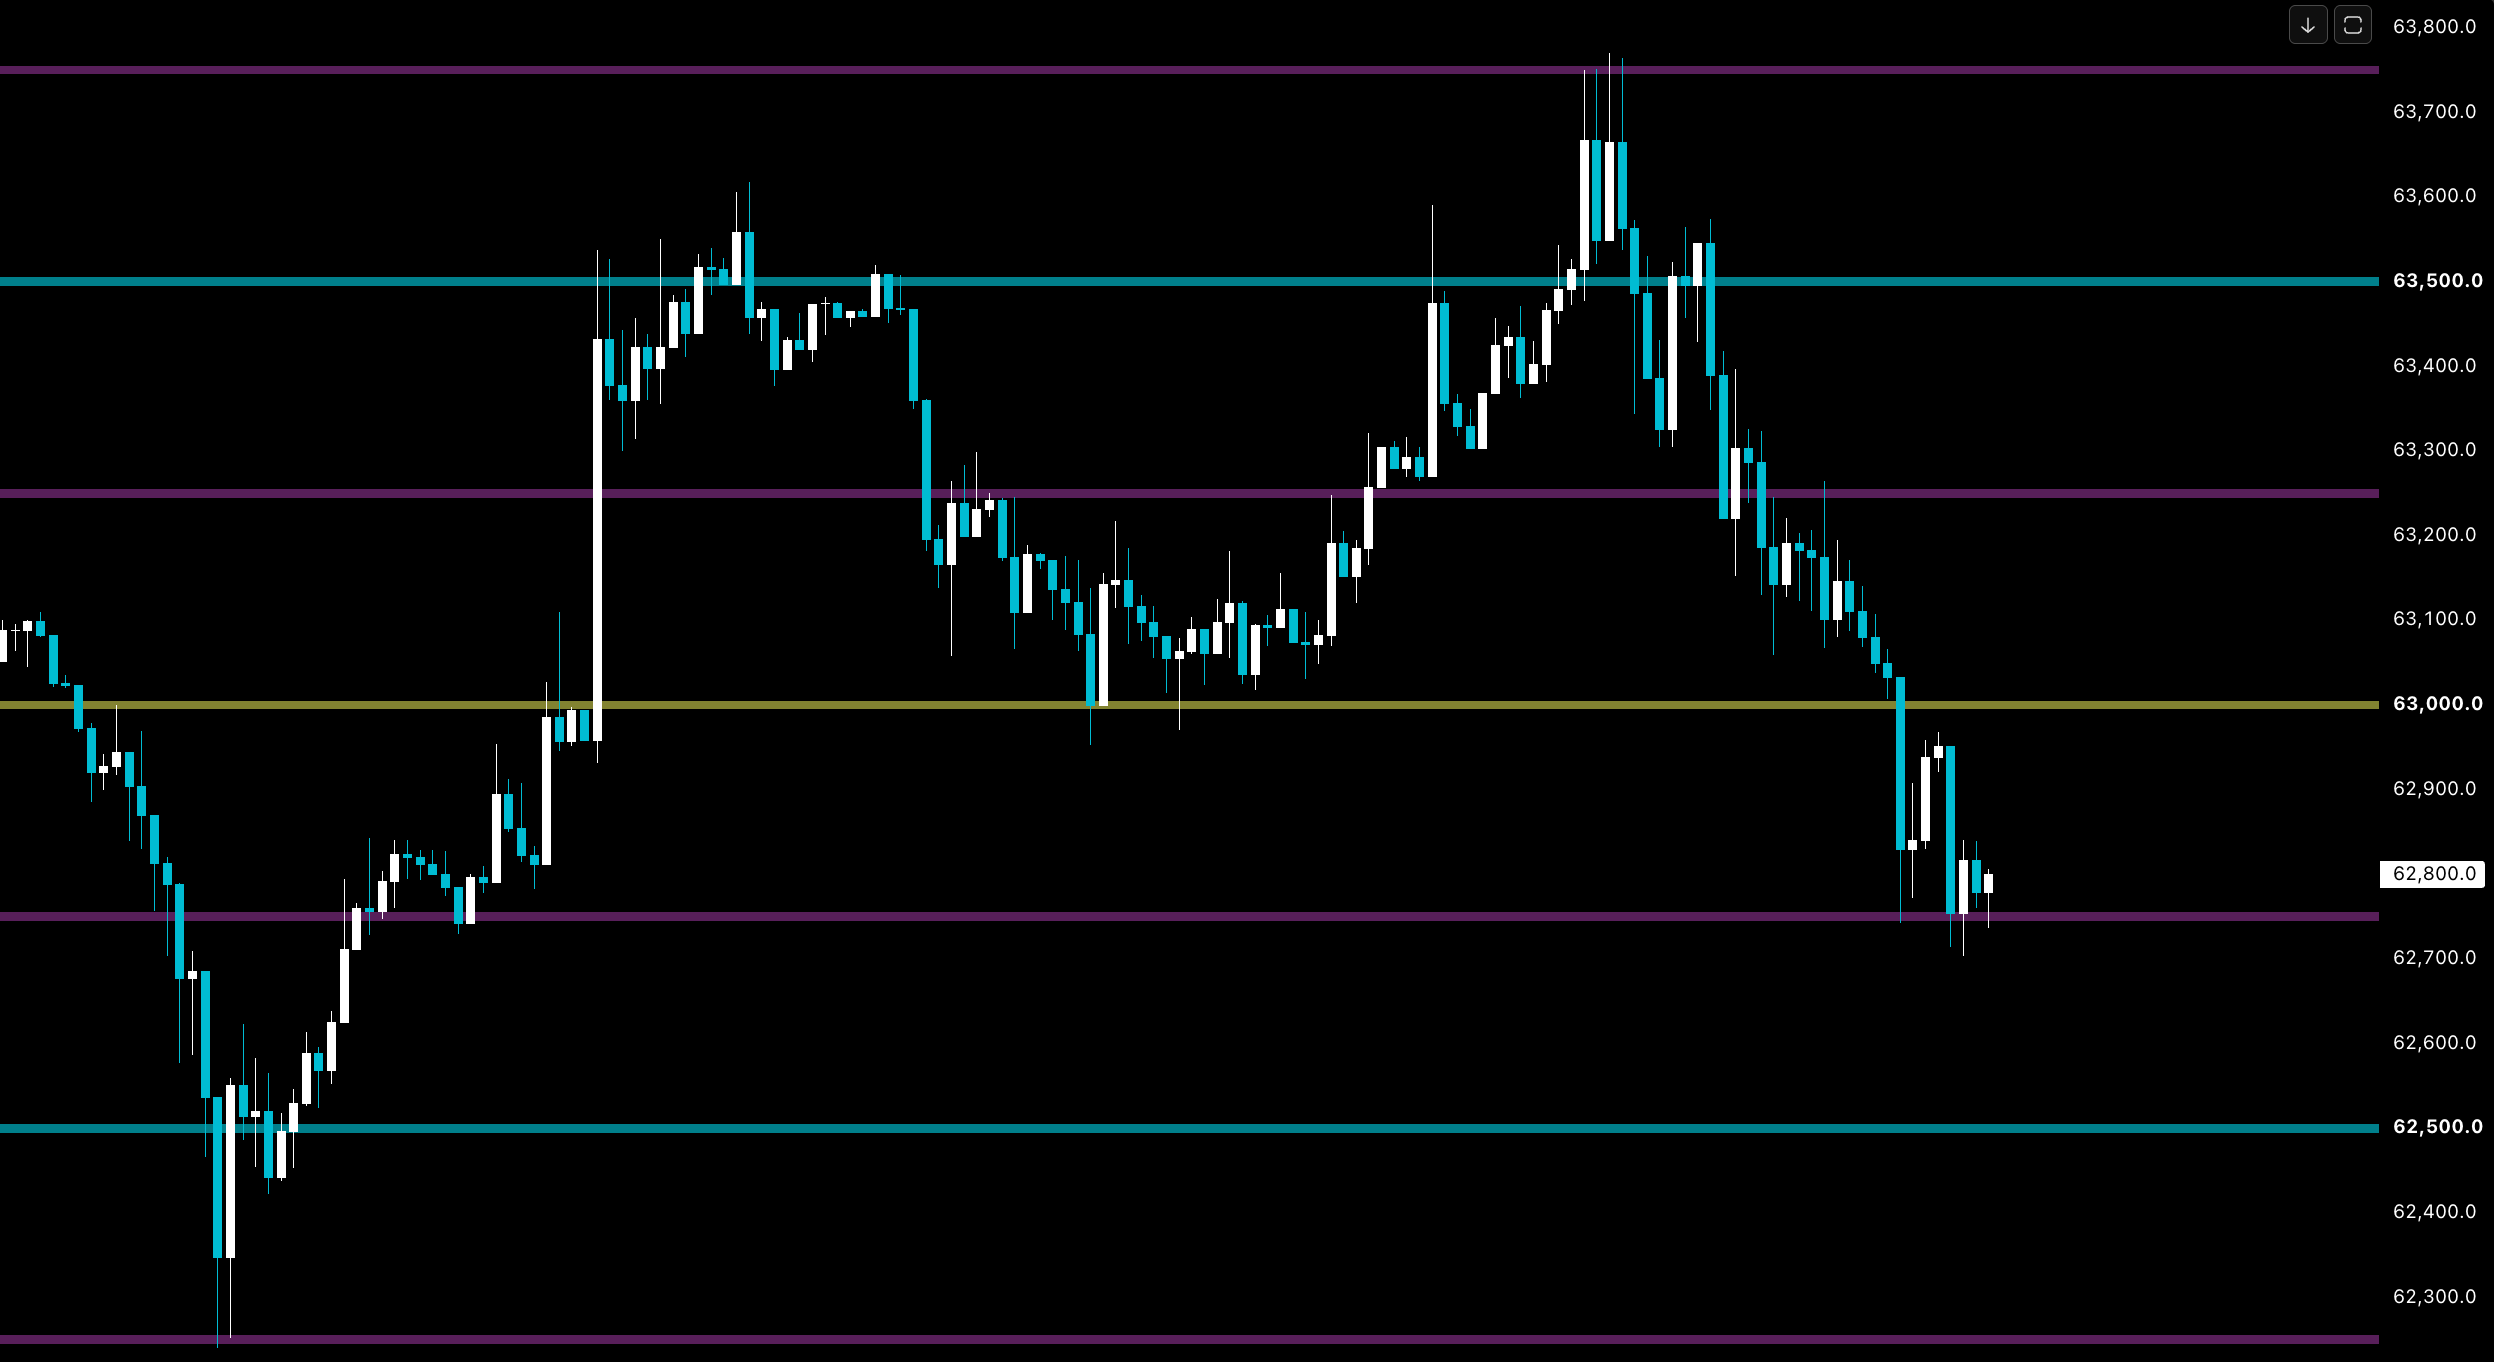
Most of the levels on a chart decide nothing. A handful decide everything, and they are the ones price keeps coming back to. From here on you know which is which — and you are already standing there when the rest of the market works it out.
- Round-number zones on any symbol and any timeframe
- Five tiers, from the majors down to the minors, each switchable
- Asset class detected automatically — metals, crypto, indices, forex, the dollar index
- Shaded bands rather than lines, because price respects an area
- Palette adapts to a bright or dark chart, or set every tier yourself
What kind of market is this?
A yes-or-no trend filter throws away everything worth knowing
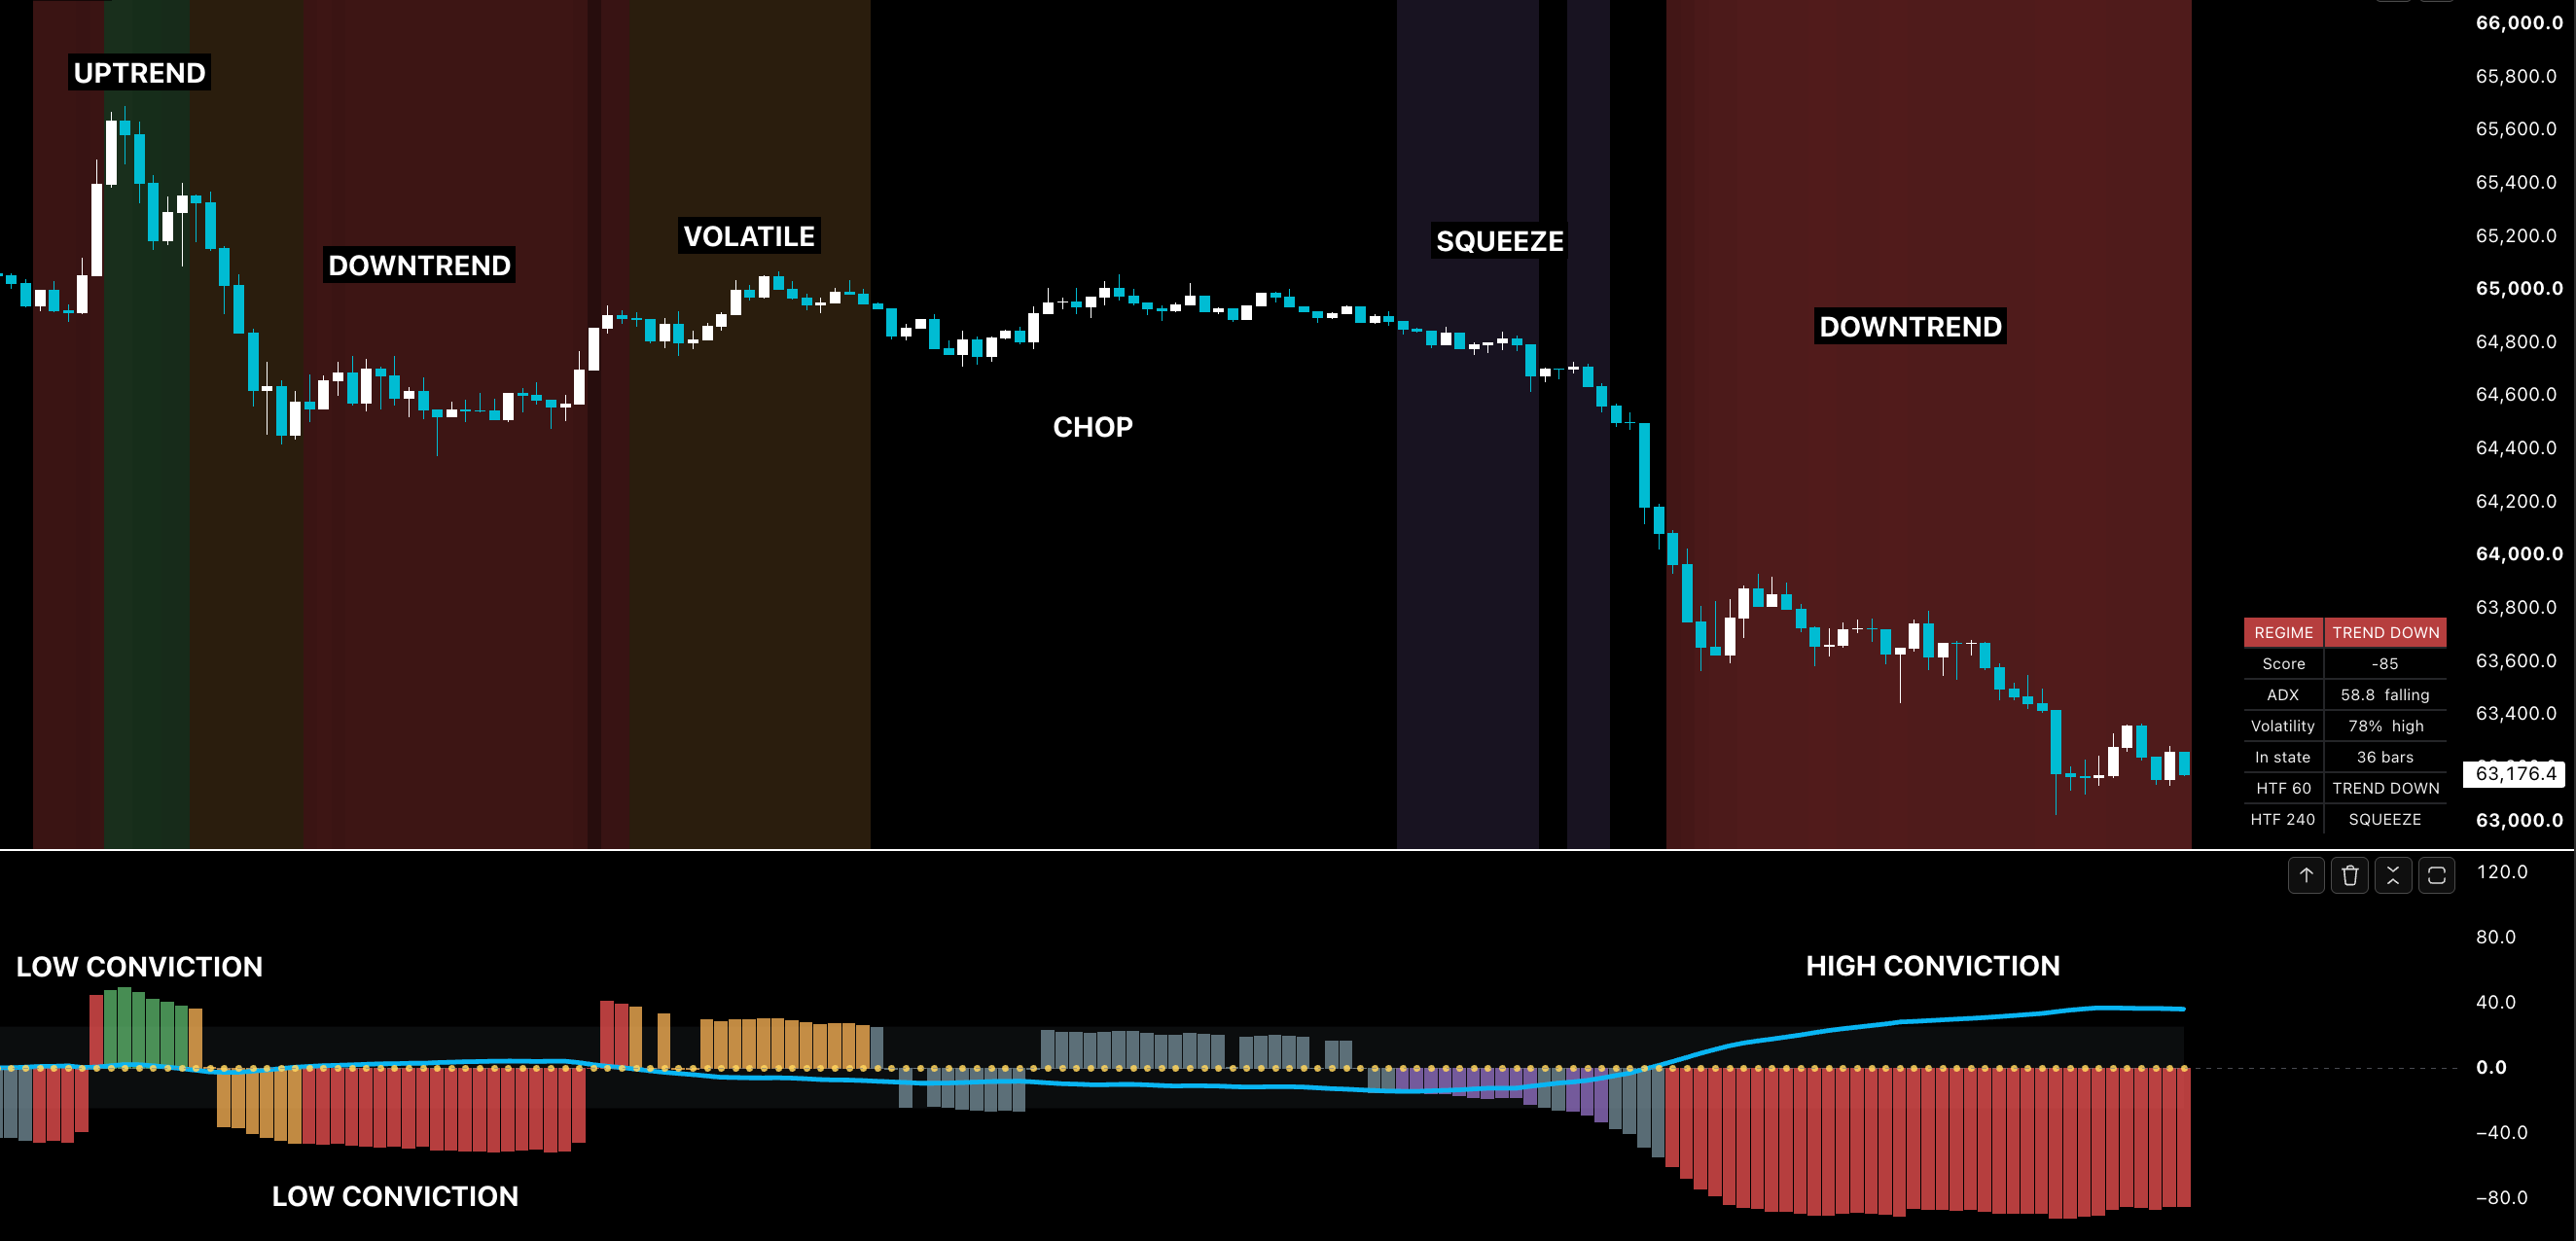
A market can be trending hard, trending weakly, coiled and quiet, violent and going nowhere, or simply drifting. Those are five different situations that call for five different responses, and a single green light cannot tell them apart. REGIME DIGGA names the situation and tells you how much to believe it.
- Six states — Trend Up, Trend Down, Squeeze, Volatile, Chop and Conflict
- A score from −100 to +100 — the sign is direction, the size is conviction
- Volatility on its own axis, so a coiled squeeze is told apart from a whipsaw
- The full verdict on two higher timeframes, in a status table
- Six alerts — state changes, trend turns, squeezes, and the score crossing zero
Three plans. Two editions.
Every tool below comes with PRO or ULTRA, and so does anything released after you subscribe — the edition decides how deep you can go into them, not how many of them you get. On ENTRY you have the one vehicle you picked, with ZONE DIGGA and REGIME DIGGA beside it.
- ENTRY PICK · PRO · ULTRAGOLD DIGGA PRO
Five measured lane configurations, running in parallel. Visual settings only.
- ENTRY PICK · PRO · ULTRACRYPTO DIGGA PRO
The same engine, measured on crypto — BTC and ETH built in, nothing running that was not tested.
- ENTRY PICK · PRO · ULTRAINDEX DIGGA PRO
The Nasdaq, on both of its tapes — and the one toggle that makes a setup count twice.
- ENTRY · PRO · ULTRAZONE DIGGA
The levels everyone agrees on before price arrives — and the ones the chart built for itself.
- ENTRY · PRO · ULTRAREGIME DIGGA
Names the kind of market you are in, and how much to believe it.
- Only with ULTRA
- ULTRA onlyGOLD DIGGA PRO ULTRA
The tuning bench. A full backtest strategy — measure your own lane, on any symbol.
- ULTRA onlyINDEX DIGGA PRO ULTRA
The bench the index cells were built on — four lanes, one at a time, and the strings PRO plays.
- ULTRA onlyPRESET DIGGA
Paste a preset string and read exactly what it declares, before you run it.
ULTRA is not a longer list of indicators. It is depth on the same ones — the part that lets you measure an instrument nobody has measured, instead of trading the ones we did.
- A real TradingView strategy — equity curve, trade list, deep backtesting
- Every threshold below the preset boundary, unlocked
- Save a measurement as a preset string, and load it back in one field
- The context timeframes follow the chart you trade, rather than the one it shipped with
- PRESET DIGGA, to read any string in full before you run it
- One measurement request every two months — name the asset, we measure it
The bench. Measure it yourself.
PRO and ULTRA cover the whole catalogue. The edition decides how deep you can go, not how many indicators you get — and this is the depth.
Measure it on the instrument you actually trade
The same engine, running as a real TradingView strategy: equity curve, trade list, deep backtesting over a full year. One lane at a time and one position at a time, so a measurement means something — and what comes out is a preset string you can keep, load back in one field, or hand to another subscriber.
- A real strategy on TradingView — equity curve, trade list, deep backtesting
- Every threshold below the preset boundary, unlocked
- The context timeframes follow you — 5m/15m if you trade the five, 15m/1h if you trade the fifteen
- Save a finished measurement as a preset string, and load it back in one field
- Ask us to measure your favourite asset — one request every two months
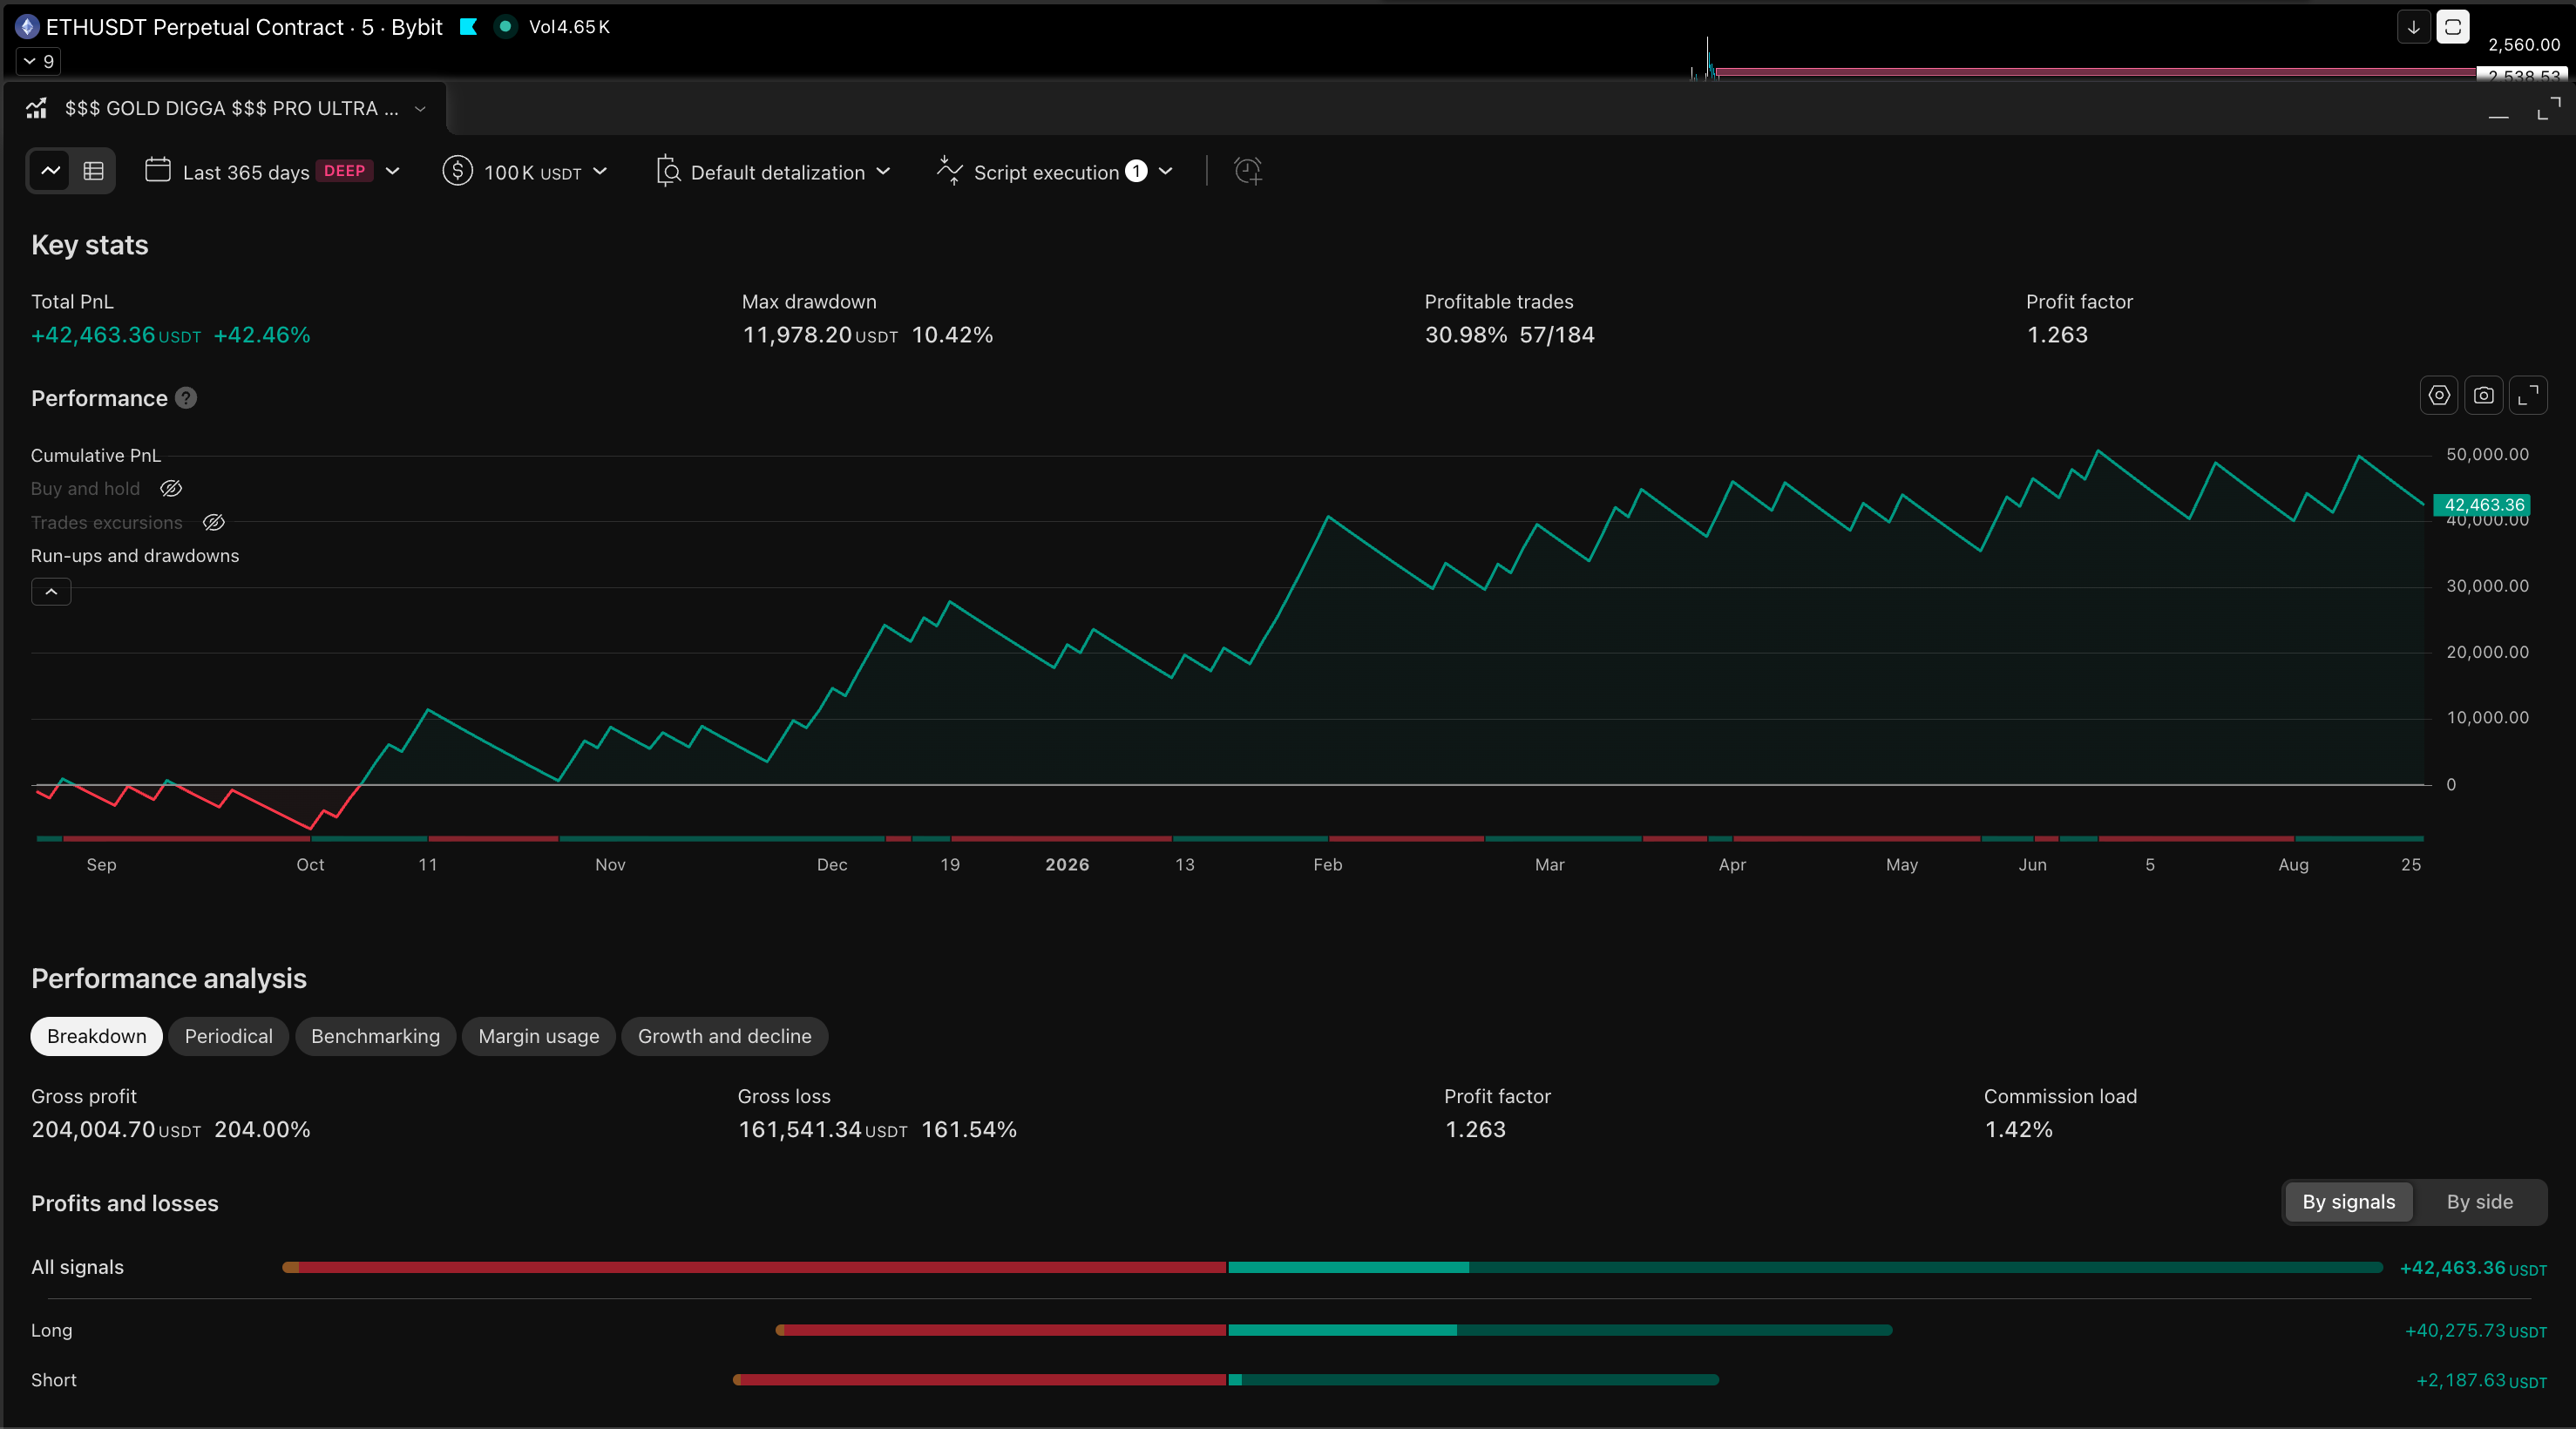
That run in full: 184 trades across the year, profit factor 1.26, maximum drawdown 10.4%, just under a third of trades profitable. It was measured in a year Ethereum rose, so it has not been shown to work in a falling one, and the curve spends its first six weeks under water. One instrument, one year, measured by the people selling it.
Backtest results — past performance is not indicative of future results.
One bundle. However you trade.
There is no one way to use these
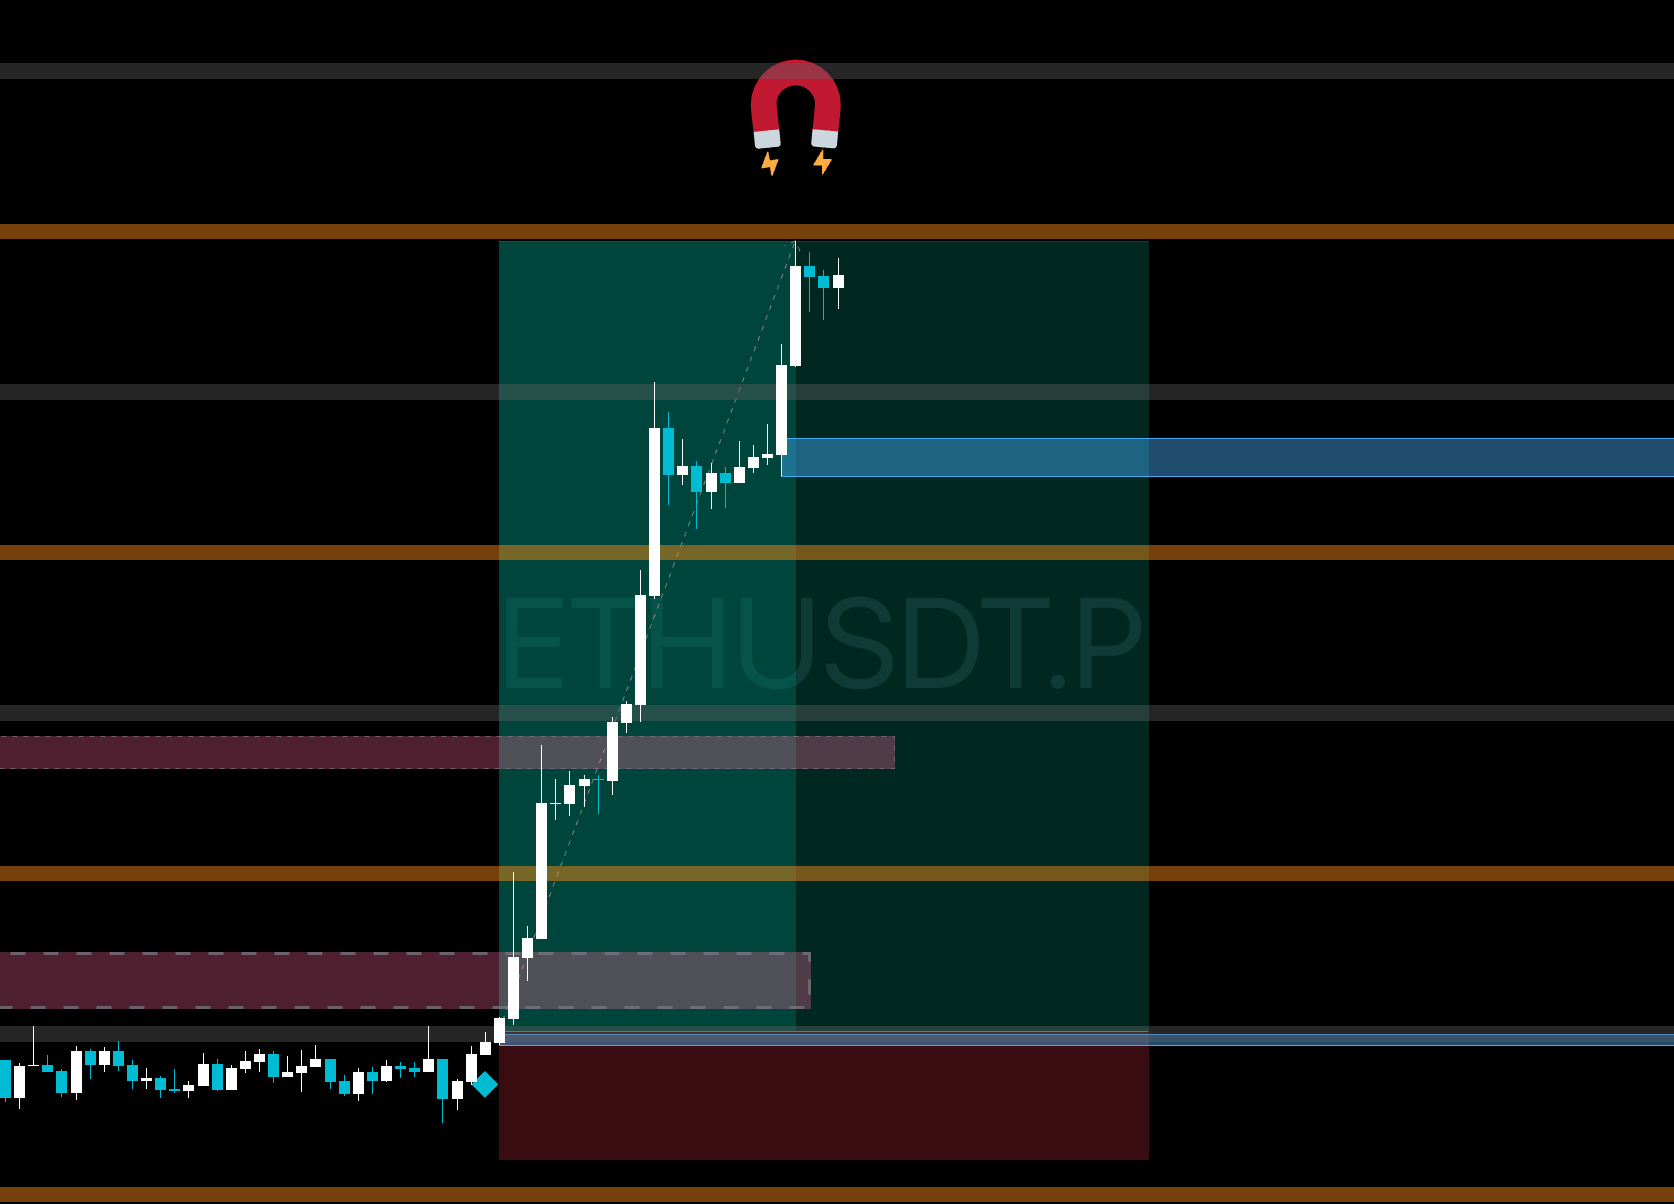
Breakouts, reversals, session opens, mean reversion, a level you drew yourself last Tuesday — run whatever you already run, on whatever you already trade. What these add is agreement: when your read and these zones point the same way you take the trade knowing why, and when they do not you found that out before it cost you anything. Nothing here tells you what to do, nothing needs you to abandon a method that already works, and nothing stops working because you trade differently from the person who wrote it. The chart here is one of countless combinations — the indicator dropped on Ethereum as it comes, catching one good move, which is worth exactly what one chart is ever worth.
Both in development. When they ship they arrive in a PRO or ULTRA account at the edition you are on, at no extra cost; a new vehicle becomes one ENTRY can pick.
Majors and crosses, with session behaviour built into the tuning.
A model reads your chart and gives a second opinion on every setup.
Take the reasoning instead.
The measurements, as they happen
What was tested, what it returned, and what got thrown out — including the ideas that looked good and did not survive the second half of the data.
- New tuning as it ships — which market, which lanes, measured over which window
- The refutations: what was tried, why it failed, and what that ruled out for good
- When a new indicator lands, and when the founding seats run out